


Fluke 434/435
Users Manual
18-2
A / L1
B / L2
C / L3
A / L1
B / L2 PER PHASE
C / L3
A / L1
B / L2
C / L3
DIPS
INTERRUPTIONS
RAPID VOLTAGE CHANGES
SWEELS
UNBALANCE
FREQUENCY
MAINS SIGNALING
ALL PHASE
S
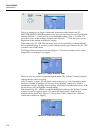
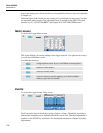
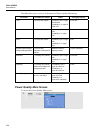
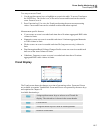
Figure 18-1. Power Quality Monitor Main Screen
The length of a bar increases if the related parameter is further away from its nominal
value. The bar turns from green to red if an allowed tolerance requirement is violated.
Use the left/right arrow keys to position the cursor on a particular bar and measuring data
belonging to that bar is displayed in the screen header.
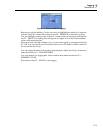
Power Quality Monitoring is usually done during a long observation period. The function
is entered via the MONITOR key and a start menu to define immediate or timed start of
the measurement. Minimum duration of the measurement is 2 hours. An usual measuring
period is 1 week.
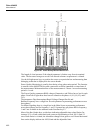
The Power Quality parameters RMS voltages, Harmonics, and Flicker have a bar for each
phase. From left to right these three bars are related to the phases A (L1), B (L2), and C
(L3).
The parameters Dips/Interruptions/Rapid Voltage Changes/Swells and
Balance/Frequency have a single bar for each parameter representing performance across
three phases.
For Mains Signaling there is a single bar in the Main Screen representing performance
across three phases and for frequency 1 and 2. Separate bars per phase and for frequency
1 and 2 are available in the submenu under Function key F5.
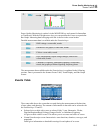
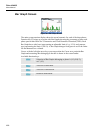
Most of the Bar Graphs have a wide base indicating adjustable time related limits (for
instance 95 % of time within limit) and a narrow top indicating a fixed 100 % limit. If
one of both limits is violated, the related bar changes from green to red. Dotted horizontal
lines on the display indicate the 100% limit and the adjustable limit.