


Power Quality Monitoring
Introduction18
18-3
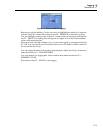
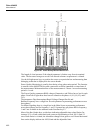
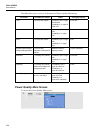
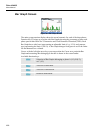
The meaning of the bar graphs with a wide base and a narrow top is explained below. By
way of example this is done for the RMS voltage. This voltage for instance has a nominal
value of 120 V with a tolerance of + and – 15% (tolerance range between 102 … 138 V).
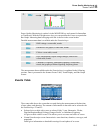
The momentary RMS voltage is constantly monitored by the Analyzer. It calculates an
average from these measuring values across 10-minute observation periods. The 10-
minute averages are compared against the tolerance range (in this example 102 ... 138 V).
The 100 % limit means that the 10-minute averages must always (i.e. 100 % of time or
with 100 % probability) be within range. The bar graph will turn to red if a 10-minute
average crosses the tolerance range.
The adjustable limit of for instance 95 % (i.e. 95 % probability) means that 95 % of the
10-minute averages must be within tolerance. The 95 % limit is less stringent than the
100 % limit. Therefore the related tolerance range usually is tighter. For 120 V this for
instance can be + or – 10 % (a tolerance range between 108 ... 132 V).
The bars for Dips/Interruptions/Rapid Voltage Changes/Swells are narrow and indicate
the number of limits violations that occurred during the observation period. The allowed
number is adjustable (for instance to 20 Dips/week). The bar turns to red if the adjusted
limit is violated.
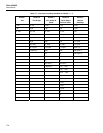
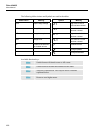
You can use a pre-defined set of limits or define your own. An example of a pre-defined
set is that according to the EN50160 standard. A maximum of 6 sets can be chosen: 2
factory installed sets, 2 sets only definable by the administrator via FlukeView SW43W
software, and 2 sets that can be changed on the Analyzer. Selection and definition of
limits is accessible via the SETUP key, ‘limits’ selection and then Function key F3 –
EDIT.