


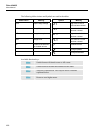
Power Quality Monitoring
Events Table18
18-5
d
F5
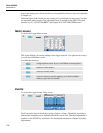
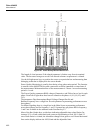
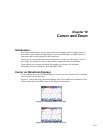
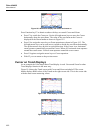
Power Quality Monitoring is reached via the MONITOR key and a menu for Immediate
or Timed start. With the left/right arrow keys you can position the Cursor on a particular
Bar Graph. Measuring data belonging to the bar is shown in the screen header.
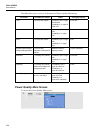
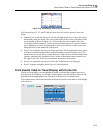
Detailed measurement data is available under the Function keys:
F1
RMS voltage: events table, trends.
F2
Harmonics: bar graphs, events table, trends.
F3
Flicker: events table, trends.
F4
Dips, Interruptions, Rapid voltage changes, and Swells:
events table, trends.
F5
Unbalance, Frequency, and Mains Signaling: events table,
trends, bar graphs per Mains Signaling frequency/phase.
The measurement data available under the Function keys is explained in the following
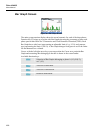
sections. Data is presented in the formats Events Table, Trend Display, and Bar Graph
Screen.
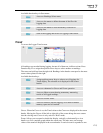
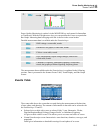
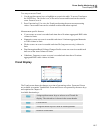
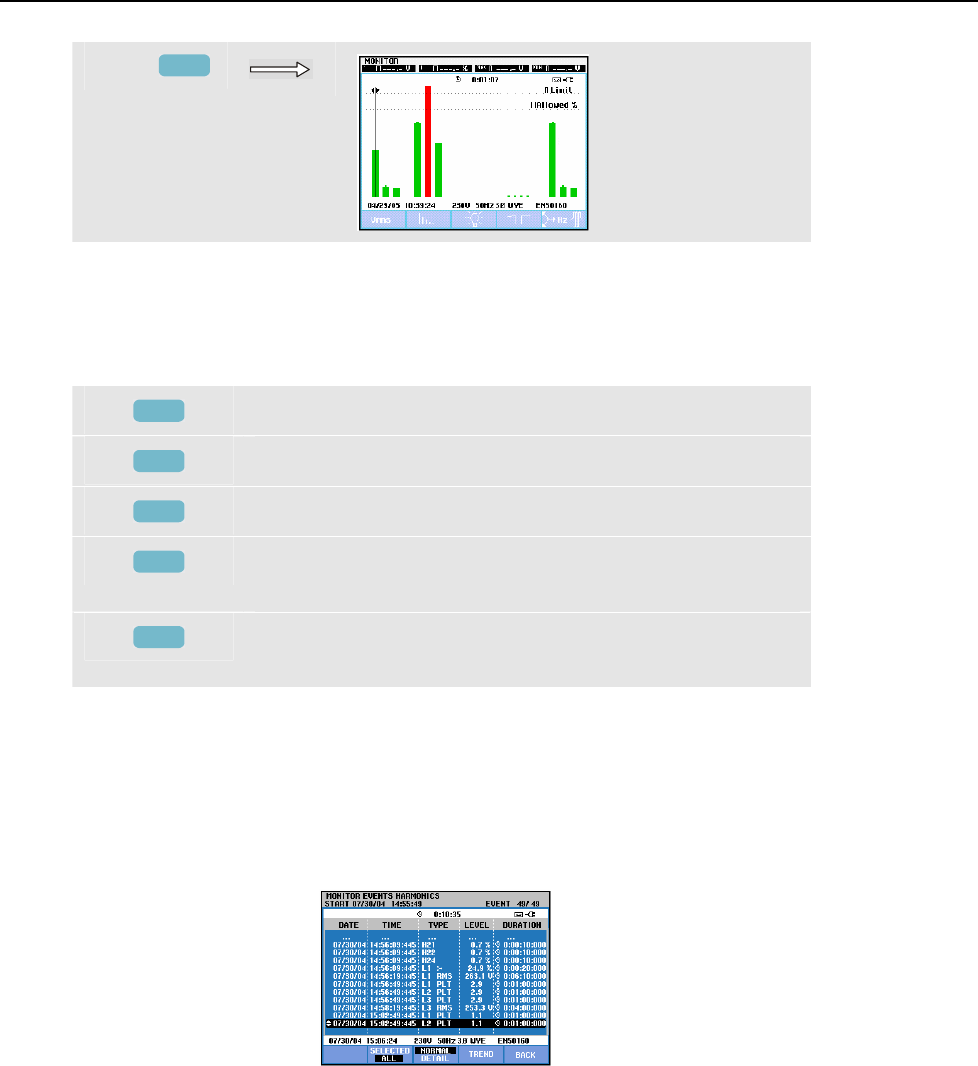
Events Table
Figure 18-2. Events Table
The events table shows the events that occurred during the measurement with date/time
of start, phase, and duration. The amount of information in the table can be selected with
the Function keys F2 and F3:
• Selected gives a table with events as selected: Only V rms, Harmonics, Flicker,
Dips/Interruptions/Rapid Voltage Changes/Swells, or Unbalance/Frequency.
All gives a table with all events. This allows you to see cause and effect of events.
• Normal lists the major event characteristics: start date/time, duration, event type, and
magnitude.
Detail gives information on threshold crossings for each phase of an event.