


Fluke 434/435
Users Manual
18-8
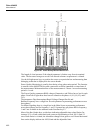
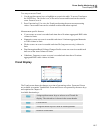
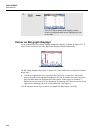
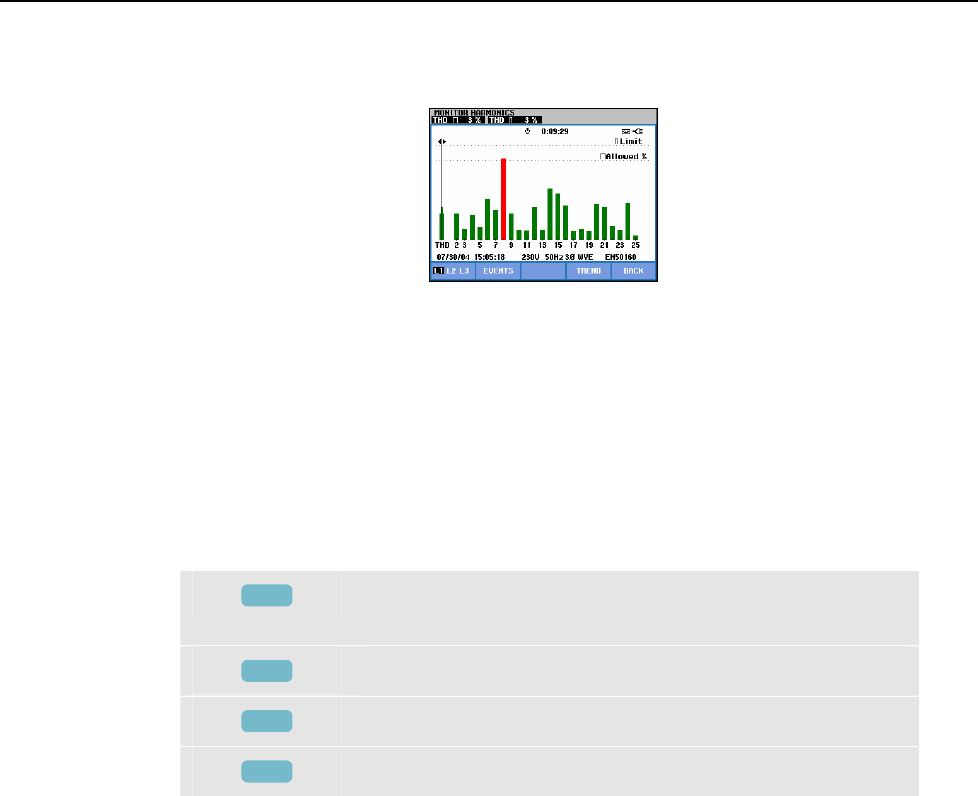
Bar Graph Screen
Figure 18-4. Bar Graph Screen
The main system monitor display shows the worst harmonic for each of the three phases.
Function key F2 brings up a screen with Bar Graphs showing the percentage of time each
phase spent within limits for 25 harmonics and Total Harmonic Distortion (THD). Each
Bar Graph has a wide base (representing an adjustable limit of e.g. 95 %) and a narrow
top (representing the limit of 100 %). A Bar Graph changes from green to red if the limits
for that harmonic are violated.
Cursor: with the left/right arrow keys you can position the Cursor on a particular Bar
Graph and measuring data belonging to that bar is shown in the screen header.
Available function keys:
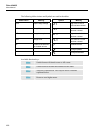
F1
Selection of Bar Graphs belonging to phase A (L1), B (L2),
or C (L3).
F2
Access to events table.
F4
Access to Trend screen.
F5
Return to main menu.