


Chapter 2 Fault Isolation 2-17
2.4.2 Monitoring Output
To understand error conditions, collect the monitoring output information. For the
collection of the information, use the commands shown in
TABLE 2-8.
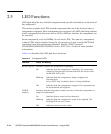
2.4.3 Messaging Output
To understand error conditions, collect messaging output information, use the
commands shown in
TABLE 2-9.
Each error message logged by the predictive self-healing architecture has a code
associated with it as well as a web address that can be followed to get the most up-
to-date course of action for dealing with that error.
Refer to the Solaris 10 documentation for more information on predictive self-
healing.
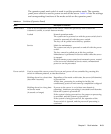
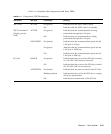
TABLE 2-8 Commands for Checking the Monitoring Output
Command Operand Description
showlogs(8) console Displays console of Domain.
monitor Logs messages that are displayed in the message window.
panic Logs output to the console during a panic.
ipl Collects console data generated during the period of the
power on of a domain to the completion of the operating
system start.
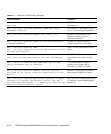
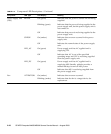
TABLE 2-9 Commands for Checking the Messaging Output
Command Operand Description
showlogs env Displays the temperature history log. The environmental
temperature data and power status are indicated in 10-minute
intervals. the data is stored for a maximum of six months.
power Displays the power and reset information.
event Displays information reported to the operating system and
stored as event logs.
error Displays error logs.
fmdump(1M)
fmdump(8)
Displays fault management architecture diagnostic results and
errors. It is provided as a Solaris command and XSCF Shell
command.