


HP WDB offers the following memory-debugging capabilities:
• Reports memory leaks
• Reports heap allocation profile
• Stops program execution if bad writes occur with string operations such as strcpy
and memcpy
• Stops program execution when freeing unallocated or de-allocated blocks
• Stops program execution when freeing a block if bad writes occur outside block
boundary
• Stops program execution conditionally based on whether a specified block address
is allocated or de-allocated
• Scrambles previous memory contents at malloc() and free() calls
• Simulates and detects out-of-memory event errors
• Detects dangling pointers and dangling blocks
• Detects in-block corruption of freed blocks
• Specifies the amount of guard bytes for every block of allocated memory
• Displays the run time type information for C++ polymorphic objects
You can use any of the following methods to identify memory problems:
• See “Debugging Memory in Interactive Mode” (page 159).
• See “Debugging Memory in Batch Mode” (page 164).
• See “Debugging Memory Interactively After Attaching to a Running Process”
(page 171).
14.10.4 Debugging Memory in Interactive Mode
This section describes the various commands which help in debugging memory
problems when the debugger is used in the interactive mode.
14.10.4.1 Commands for interactive memory debugging
To debug memory problems, use these commands:
set heap-check [on|off]
This toggles the capability for detection of leaks,
heap profiles, bounds checking, and checking for
double free.
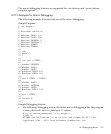
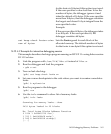
info heap
Displays a heap report, listing information such
as the start of heap, end of heap, heap size, heap
allocations, size of blocks, and number of
instances. The report shows heap usage at the
point you use the info heap command. The
report does not show allocations that have
already been freed. For example, if you make
several allocations, free them all, and then you
14.10 Debugging Memory Problems 159