


2. Run the program.
3. Start a debugging session as follows:
gdb -leaks <executable-name> <process-id>
4. Use info heap and info leaks commands to obtain a memory analysis report
of the application.
NOTE: From HP WDB 5.7 onwards, the archive version of the run time check library,
librtc.a, is not available. You must use the shared version of the library,
librtc.[sl|so], instead.
14.10.7 Configuring memory debugging settings
The following configuration settings are supported to control the level of details of
information required to be displayed when debugging memory leaks.
14.10.7.1 Specifying the stack depth
Memory debugging reduces the performance of an application by 20-40% because of
stack unwinding. To provide a clear profile of every allocation in the program, the
debugger collects the stack trace information for every allocation in the debugged
application. Reducing the stack depth (the number of stack frames that the debugger
collects for each allocation) reduces the performance degradation.
The set heap-check frame-count command enables you to control the depth
of the stack frames that are collected by WDB for each allocation. By default, four stack
frames are displayed from the allocating call stack.
To set the depth of the stack frames that is collected by WDB, enter the following
command at the gdb prompt:
$ set heap-check frame-count [num]
The stack depth, [num], is the number of stack frames that WDB collects for each
allocation.
You can specify a higher value for [num] to view more stack frames for each reported
allocation. However, the performance of the application is reduced because of the
increased stack depth.
14.10.7.2 Specifying minimum leak size
WDB enables you to specify the minimum leak size for stack trace collection to improve
the program's performance.
Stack trace collection slows down the program because it occurs on every allocation
call. Therefore, if the program is allocation-intensive, WDB can spend a substantial
amount of time collecting stack traces.
You can improve performance by using the command:
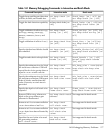
14.10 Debugging Memory Problems 173