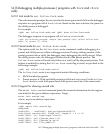
$ chatr +dbg enable ./<executable>
(This step is not required on Integrity systems.)
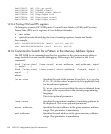
To explicitly preload the librtc runtime library and start the target application,
enter one of the following commands:
— For 32 bit IPF applications,
LD_PRELOAD=/opt/langtools/lib/hpux32/librtc.so <executable>
— For 64 bit IPF applications,
LD_PRELOAD=/opt/langtools/lib/hpux64/librtc.so <executable>
— For 32 bit PA applications,
LD_PRELOAD=/opt/langtools/lib/librtc.sl <executable>
— For 64-bit PA applications,
LD_PRELOAD=/opt/langtools/lib/pa20_64/librtc.sl <executable>
If LD_PRELOAD and chatr +rtc are used to preload the librtc runtime library
, the librtc runtime library is loaded from the path specified by
LD_PRELOAD.
3. Complete one of the following steps:
• Attach the debugger to the required process and enable thread debugging,
as follows:
gdb -thread -p <pid>
or
gdb -thread <executable> <pid>
• Alternately, you can attach the process to the debugger and consequently
invoke thread debugging, as follows:
$ gdb <executable> <pid>
...
(gdb)set thread-check on
14.11.5 Thread Debugging in Batch Mode
HP WDB supports batch mode of debugging threads for HP-UX 11iv2 and later, on
Integrity systems and on HP-UX 11i v3 in PA-RISC systems for 64 bit applications. The
debugger provides a log file with the list of thread-related errors that occur in the
application.
In batch mode, the debugger detects the all the thread-conditions that are detected
during an interactive debugging session.
The debugger reports extended information such as variable address, name, id and
other specifications related to the involved pthread objects. In addition, it displays the
stack trace of the executing thread at the point of error.
14.11 Thread Debugging Support 189


