


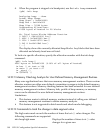
4. When the program is stopped at a breakpoint, use the info heap command:
(gdb) info heap
Analyzing heap ...done
Actual Heap Usage:
Heap Start = 0x40408000
Heap End = 0x4041a900
Heap Size = 76288 bytes
Outstanding Allocations:
41558 bytes allocated in 28 blocks
No. Total bytes Blocks Address Function
0 34567 1 0x40411000 foo()
1 4096 1 0x7bd63000 bar()
2 1234 1 0x40419710 baz()
3 245 8 0x404108b0 boo()
[...]
The display shows the currently allocated heap blocks. Any blocks that have been
allocated and already freed are not listed.
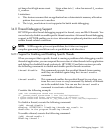
To look at a specific allocation, specify the allocation number with the info heap
command:
(gdb) info heap 1
4096 bytes at 0x7bd63000 (9.86% of all bytes allocated)
in bar () at test.c:108
in main () at test.c:17
in _start ()
in $START$ ()
14.10.11 Memory Checking Analysis for User Defined Memory Management Routines
Many user applications have their own memory management routines. These custom
allocator routines are either user defined or sometimes wrappers to the default memory
management routines. Memory checking features has been extended for user defined
memory management routines. Memory leak, profile of heap memory or memory
errors can be obtained for user defined memory management routines.
Limitations:
• This feature routes to default memory routines instead of calling user defined
memory management routines to obtain memory analysis.
• This feature is not supported in batch mode and attach mode debugging.
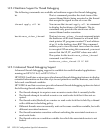
14.10.12 Commands to track the change in data segment value
The high water mark records the number of times the brk() value changes. The
following commands are supported:
info heap high-mem
Displays the number of times brk() value
changes for a given run.
180 HP-UX Configuration-Specific Information