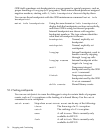
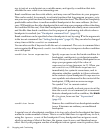
GDB itself sometimes sets breakpoints in your program for special purposes, such as
proper handling of longjmp (in C programs). These internal breakpoints are assigned
negative numbers, starting with -1; 'info breakpoints' does not display them.
You can see these breakpoints with the GDB maintenance command 'maint info
breakpoints'.
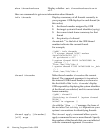
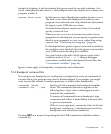
maint info breakpoints Using the same format as 'info breakpoints',
display both the breakpoints you have set explicitly,
and those GDB is using for internal purposes.
Internal breakpoints are shown with negative
breakpoint numbers. The type column identifies
what kind of breakpoint is shown:
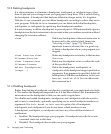
breakpoint
Normal, explicitly set
breakpoint.
watchpoint
Normal, explicitly set
watchpoint.
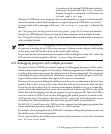
longjmp
Internal breakpoint, used to
handle correctly stepping
through longjmp calls.
longjmp resume
Internal breakpoint at the
target of a longjmp.
until
Temporary internal
breakpoint used by the GDB
until command.
finish
Temporary internal
breakpoint used by the GDB
finish command.
shlib events
Shared library events.
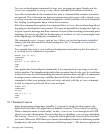
5.1.2 Setting catchpoints
You can use catchpoints to cause the debugger to stop for certain kinds of program
events, such as C++ exceptions or the loading of a shared library. Use the catch
command to set a catchpoint.
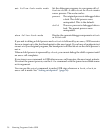
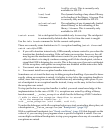
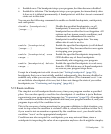
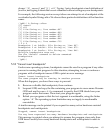
catch event Stop when event occurs. event can be any of the following:
throw
The throwing of a C++ exception.
catch
The catching of a C++ exception.
exec A call to exec. This is currently only
available for HP-UX.
fork A call to fork. This is currently only
available for HP-UX.
56 Stopping and Continuing


