


14.18 Invoking GDB Before a Program Aborts
This -crashdebug option enables GDB to monitor the execution of a process or a
program. It invokes GDB when the program execution is about to abort. Once the
debugger is invoked, you can debug the application using the normal debugger
commands. This option enables you to debug a live process instead of getting a core
dump if the program is about to abort.
You can examine the state of the process, make changes to the state and continue
program execution, force a core dump, or terminate execution. It enables you to control
program execution under the debugger if the program is about to abort. You can load
a new process or attach to a running process for monitoring.
To monitor a new process, enter the following command:
gdb -crashdebug <command> <options>
To monitor a running process, attach to the process using the following command:
gdb -crashdebug -pid <pid>
14.19 Aborting a Command Line Call
When a command line call is issued and it is interrupted by a breakpoint or a signal
before completing the program execution, the abort command enables the user to abort
the command line call without allowing the signal to modify the state of the debugged
process.
When a signal interrupts program execution, it can modify the process state of the de-
bugged program and result in an abrupt termination of the program (due to addressing
errors from a call that is not a part of the source program). In such cases, the abort
command is particularly useful in exiting the command line call without modifying
the process state of the debugged program.
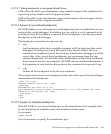
The following example illustrates the use of the abort command:
(gdb) break main
Breakpoint 1 at 0x2c74: file .../address_error.c, line 41.
(gdb) run
Starting program: ./address_error
Breakpoint 1, main () at ./address_error.c:41
41 fun (count, count*1.1);
(gdb) p fun(10, 1.1)
Program received signal SIGBUS, Bus error
si_code: 0 - BUS_UNKNOWN - Unknown Error.
0x2c38 in fun (i=10, f=0) at ./address_error.c:37
37 count = *p;
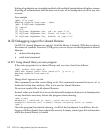
The program being debugged was signaled while in a function called from GDB.
GDB remains in the frame where the signal was received.
To change this behavior use "set unwindonsignal on"
Evaluation of the expression containing the function (fun) will be abandoned.
(gdb) bt
#0 0x2c38 in fun (i=10, f=0) at ../address_error.c:37
#1 0x1920 in _sr4export+0x8 ()
#2 <function called from gdb>
#3 0x2c74 in main () at ./address_error.c:40
(gdb) abort
14.18 Invoking GDB Before a Program Aborts 207