


To analyze this core file with HP WDB on HP-UX 11i version 2, you must do the
following:
• When starting from HP WDB command line:
(gdb) core-file [core.pid | core-filename]
• When starting from shell prompt:
$ gdb -core a.out [core.pid | core-filename]
14.15.4 Support for display of run time type information
HP WDB enables you to view the run time type information for C++ polymorphic
object.
info rtti address
This command displays run time type information for C++ polymorphic object. The
input to this command is address of the C++ polymorphic object. GDB displays the
demangled type name as output.
NOTE: This command is supported only on Integrity systems.
Sample Output
(gdb) info rtti <address>
RTTI: <run time type/class name>
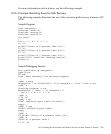
14.16 Printing the Execution Path Entries for the Current Frame or Thread
HP WDB 5.7 and later versions of the debugger enable you to print the execution path
entries in the current frame, or the current thread for programs running on Integrity
systems. This feature enables the display of the execution path taken across branched
modules. The first instruction in each block associated with the executed branch is
displayed.
This feature is supported only for compiler versions A.06.15 and later.
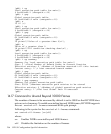
HP WDB supports the following commands to print the execution path entries in the
current frame, or in the current thread:
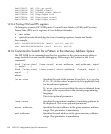
• info exec-path [start_index] [end_index] (aliased to info
ep)
Lists all the local execution path entries in the current frame. The [start_index]
and [end_index] indicate the range of table indexes (execution path entries)
that must be displayed.
If [end_index] is not specified, the debugger displays the complete table of
execution path entries, starting from [start_index].
If [start_index] and [end_index] are not specified, the complete table of
execution path entries is displayed.
14.16 Printing the Execution Path Entries for the Current Frame or Thread 203