


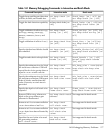

Table 14-1 Memory Debugging Commands in Interactive and Batch Mode (continued)
Batch modeInteractive modeCommand Description
Not supported in batch mode
set heap-check
random-range <num>
Specifies the random range to be
used by random-range.
Not supported in batch mode
set heap-check
interval <num>
Specifies the time interval to be used
for incremental memory profile.
Not supported in batch mode
set heap-check
repeat <num>
Perform incremental profile for
<num> interval periods where each
period duration is defined by set
heap-check interval command. The
default value is 100.
Not supported in batch mode
catch nomem
NULL pointer return by memory
allocators; used with set
heap-check on, with/without
null-check enabled.
NOTE: The files=<executable-name> and output_dir=<path> options are
exclusive to batch mode debugging.
14.10.10 Heap Profiling
The heap profile is useful for identifying how memory is being used by the program.
You can use WDB to profile an application's current heap usage.
14.10.10.1 Commands for heap profiling
info heap
Displays a heap report, listing information such
as the start of the heap, end of the heap, heap
allocations, size of blocks, and number of
instances. The report shows heap usage at the
point you use the info heap command.
The report does not show allocations that have
already been freed. For example, if you make
several allocations, free them all, and then you
use info heap, the result does not show any
allocations.
info heap filename
Writes heap report output to the specified file.
info heap idnumber
Produces detailed information on the specified
heap allocation including the allocation call stack.
set heap-check frame-count
num
Controls the depth of the call stack collected.
Larger values increase run time. The default
value is four (4) stack frames.
178 HP-UX Configuration-Specific Information