Quality of Service (QoS)
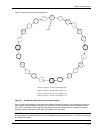
Figure 2.1 illustrates a cycle through the queues.
q3
q3
q3
q3
q3
q3
q3
q3
q3
q3
q3
q3
q3
q3
q3
q3
q3
q3
q3
q3
q2
q3
q3
q3
q3
q3
q3
q3
q3
q3
q3
q3
q3
q3
q3
q3
q3
q3
q3
q3
q3
q3
q3
q3
q3
q3
q3
q3
q3
q1
q0
Begin here
q1
q2
q2
q2
q2
q2
q2
q2
q2
Queue 3: weight=4, minimum percentage=80%
Queue 2: weight=3, minimum percentage=15%
Queue 1: weight=2, minimum percentage=3.3%
Queue 0: weight=1, minimum percentage=1.7%
Figure 2.1 Example of a QoS cycle using the default weights
If you change the percentages for the queues, the software changes the weights, which changes the number of
visits a queue receives during a full queue cycle and also the number of packets sent from each queue during
each visit. For example, if you change the percentages so that queue qosp3 receives a weight of 5, then the
system processes five packets in that queue during each visit to the queue.
NOTE: The weighted fair queuing method is based on packet-level scheduling. As a result, a queue’s bandwidth
percentage does not necessarily reflect the exact bandwidth share the queue receives. This is due to the effects
of variable size packets.
2 - 7


