


16
16
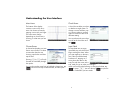
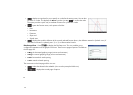
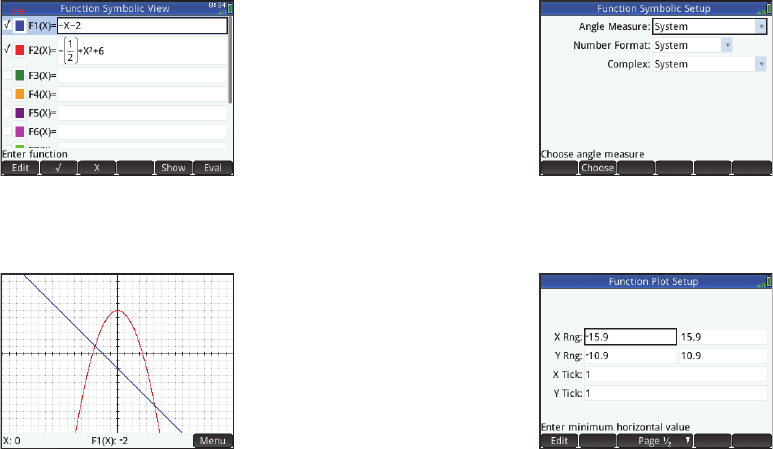
The six primary app views are illustrated below (using the Function app as an example).
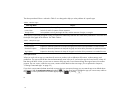
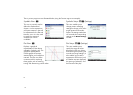
Symbolic View: Y
This view is primarily used to
define the mathematical
objects—such as expressions
and open sentences—that will
be represented in the Plot and
Numeric views. It is also used
to specify the statistical
analyses you want to
undertake.
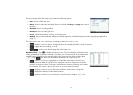
Symbolic Setup: SY (Settings)
This view enables you to
change certain underlying
settings for the app, such as the
angle measure and number
format. The settings made here
will override the corresponding
settings on the
Home Settings
window.
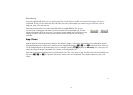
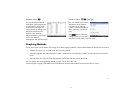
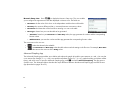
Plot View: P
Displays a graphical
representation of the objects
selected in Symbolic view. The
graphical representations
include graphs of functions,
statistical plots, and confidence
intervals. The Plot view offers
numerous tools for exploring
these graphs, such as zooming,
tracing and determining critical values.
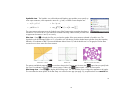
Plot Setup: SP (Settings)
This view enables you to
specify the range of values
displayed in Plot view. (Note
that zooming and panning will
override any range settings.) It
also enables you to set the
appearance of Plot view (such
as whether axes are displayed,
the spacing of tickmarks, and
the fineness of the plot).