


36
36
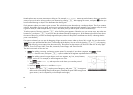
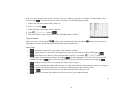
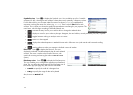
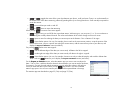
Symbolic view Press Y to display the Symbolic view. You can define up to five 1-variable
analyses (H1–H5), choosing for each analysis a data column and, optionally, a frequency column.
For the data column, you can enter either the name of a column (D0–D9) or a mathematical
expression involving the name of a column (e.g. D1*9.8). There is also a Plot field for each
analysis. This is where you choose the graphical representation most fitting for your purposes. The
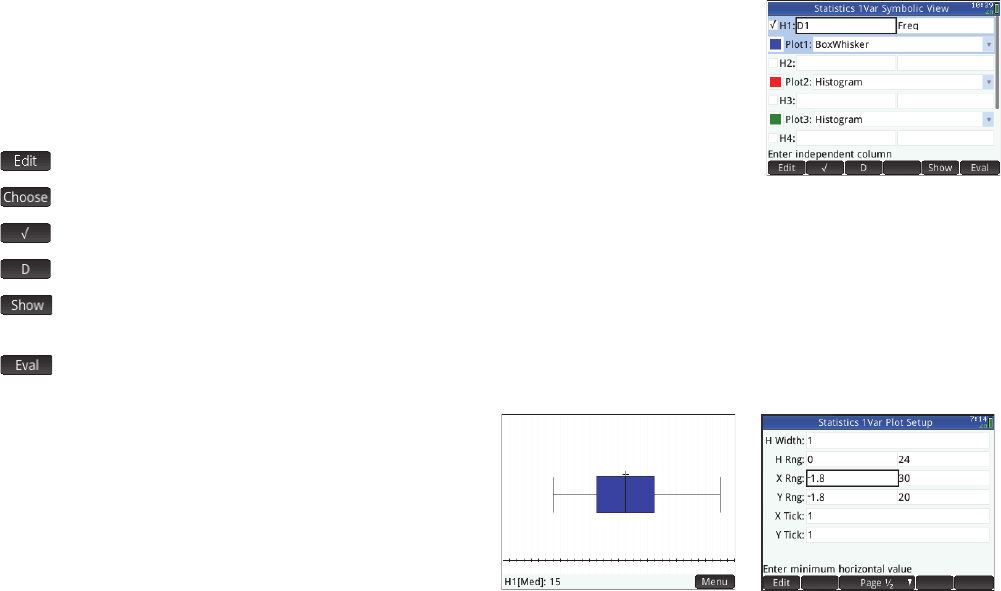
menu items, which change according to the field selected, are:
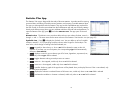
• : activates the entry line for you to add a value or change the selected value
• : displays a menu for you to select a plot type: histogram, box and whisker, normal probability, line, bar, or pareto
• : toggles between making an analysis active or inactive
• : enters a D when tapped
• : displays the selected equation in textbook format and in full-screen view (with vertical and horizontal scrolling
enabled)
• : resolves references when one equation is defined in terms of another
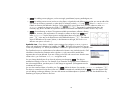
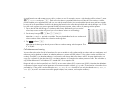
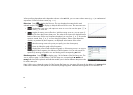
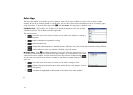
Plot view Press P to display the Plot view. This view
displays the selected 1-variable statistical plots for each selected
analysis. The menu is similar to the Function Plot view, with
options for zooming and tracing (but without a
Go To or Fcn
option).
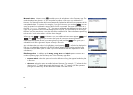
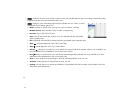
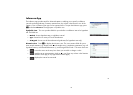
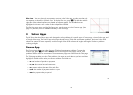
Plot Setup view Press SP to display the Plot Setup view.
This view enables you to configure the appearance of statistical
plots. This view offers the same options as the Plot Setup view of
the Function app (see
page 20), but with two extra fields:
• H Width: to specify the width of a histogram bar
• H Rng: to specify the range of data to be plotted
Also, there is no Method field.