


37
37
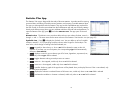
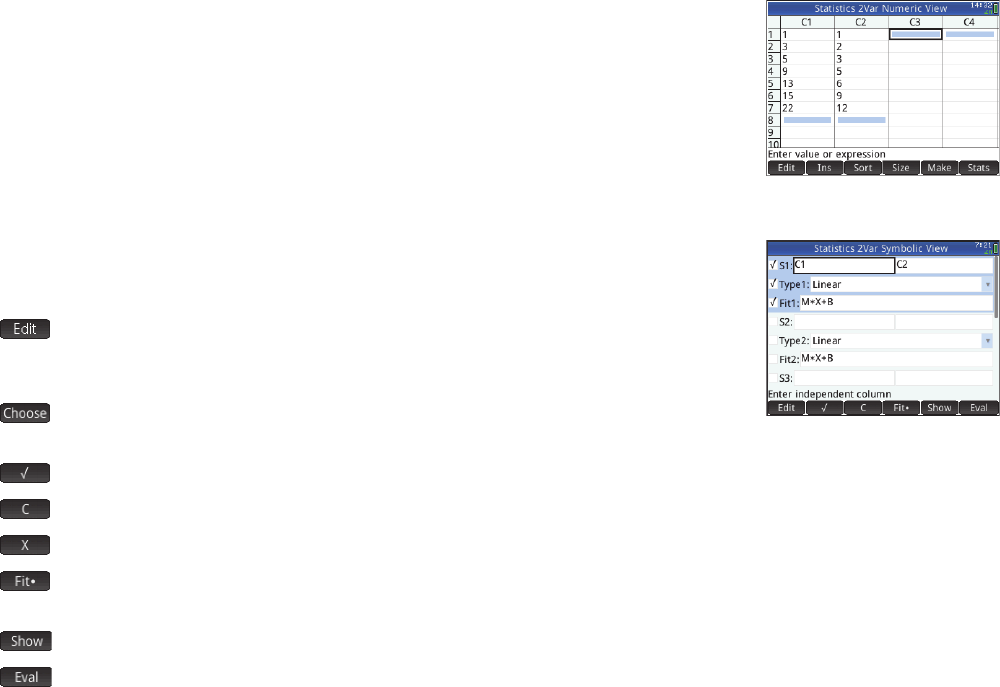
Statistics 2Var App
The Statistics 2Var app is designed for the study of bivariate statistics. It provides tools for entering
numerical data, calculating 2-variable summary statistics, and creating 2-variable statistical plots.
The app can exchange data with the Statistics 1Var app and the Spreadsheet app (explained in
the User Guide). It can also receive data from the DataStreamer app and pass summary statistics
directly to the Inference app (where you can calculate confidence intervals and test hypotheses). To
open the Statistics 2Var app, press
I and select Statistics 2Var. The app opens in Numeric
view.
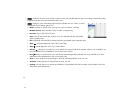
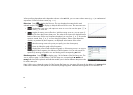
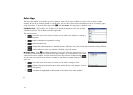
Numeric view The Numeric view provides a table with up to ten columns for data, named C1
through C9 and C0. The menu items are the same as those in the Statistics 1Var Numeric view (see
page 35).
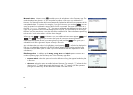
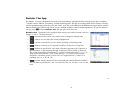
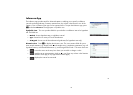
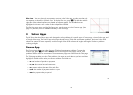
Symbolic view Press Y to display the Symbolic view. You can define up to five 2-variable
analyses, named S1–S5, by specifying two data columns and a fit type for each analysis. The
menu items, which change according to the field selected, are:
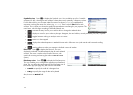
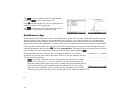
• : to specify a data column, or, when a Fitn field is selected, to enter or edit a fit
equation. If you enter your own fit equation, the corresponding Typen field automatically
changes to
User Defined.
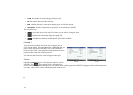
• : displays a menu for you to select a type of fit: linear, logarithmic, exponential, etc.;
visible only when a Typen field is selected
• : toggles between making an analysis active or inactive
• : enters a C when tapped; visible only when an Sn field is selected
• : enters an X when tapped; visible only when a Fitn field is selected
• : specifies whether a graph of the type chosen will be plotted when you display Plot view. If this is not selected, only
the data points are plotted.
• : displays the selection in textbook format in full-screen view; visible only when an Sn or Fitn field is selected
• : evaluates the variables in whatever is selected; visible only when an Sn or Fitn field is selected