


41
41
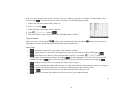
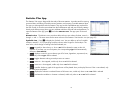
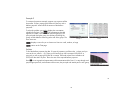
• or : toggles the action of the cursor keys between pan (that is, scroll) and zoom. Zoom in or out horizontally on
the streams even while data is streaming, effectively speeding them up or slowing them down. Scroll vertically to separate or
center the streams.
• : turns oscilloscope mode on and off
• or : starts or stops data streaming
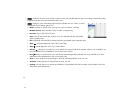
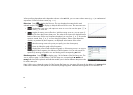
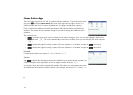
When you tap three more menu items appear:
• : toggles tracing on and off for the current data stream. With tracing on, you can press < or > to move the trace
cursor along the currently selected channel. The values at the bottom of the screen change as the cursor moves.
• : opens a menu for selecting the data you want to export to the Statistics 1Var or Statistics 2 Var apps
• : shows further options. You can, for example, place a mark at the current tracer position, swap the position of the
mark and the tracer, jump to a specific time along the current stream, add the current tracer point to your data set, and
display the
Export to Statistics screen (see below).
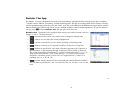
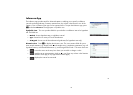
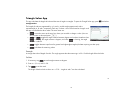
On pressing further menu items appear:
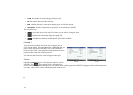
• : sets the left-most edge of the data you want to study. All data to the left is cropped.
• : set the right-most edge of the data you want to study. All data to the right is cropped.
• : shows further options. You can, for example, choose to see only a subset of samples, and to add or delete data.
There is also an button for you to display the Export to Statistics screen (see below).
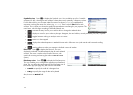
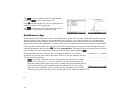
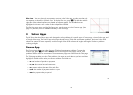
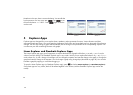
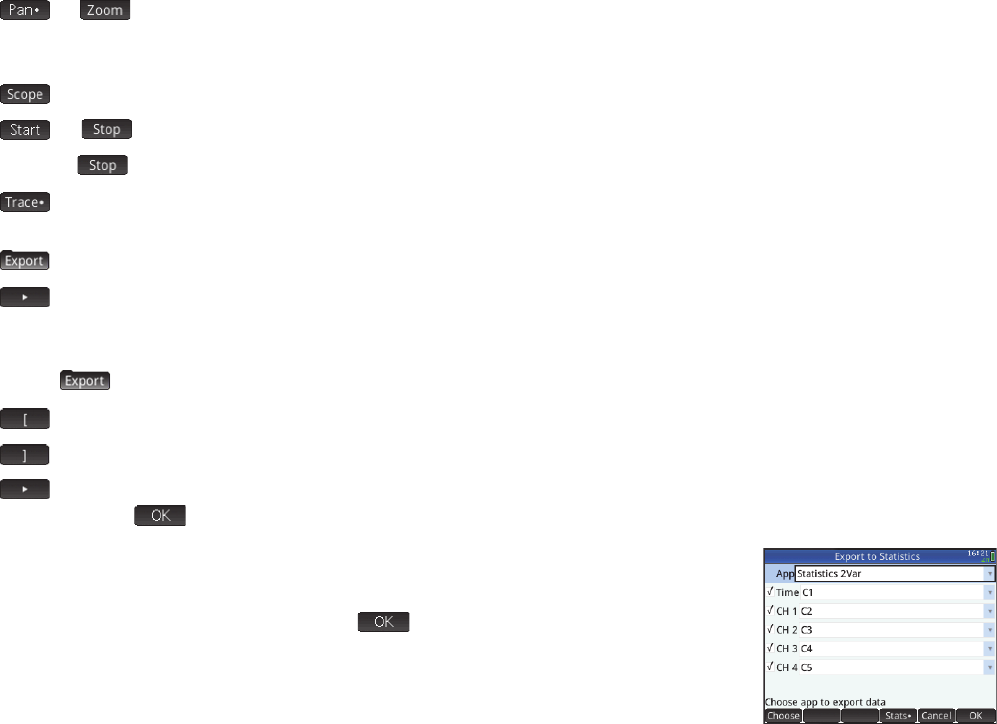
On the Export to Statistics screen, select the statistics app you want to use to analyze the
data—1Var or 2Var—and then select the channels whose statistics you want to analyze (and time,
if necessary). For each channel and the timestamp, you can select the column in the app into
which you want that data copied. When you tap
, the Numeric view of the selected
statistics app opens. You can now continue your analysis of the captured data in that app.
The statistics apps are described on page 35 (1Var) and page 37 (2Var).