


20
20
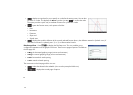
• : displays an input box for you to specify an x-value for the tracing cursor. You can also
just enter an x-value. This displays the Go To input box. Just tap to confirm the value.
This option provides a quick way to evaluate a function for a particular x-value.
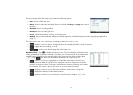
• : opens the Function menu, with options to find the:
Root
Intersection
Extremum
Slope and
Signed area.
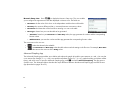
• : displays the symbolic definition of the currently selected function (that is, the definition entered in Symbolic view). If
more than one function is plotted, press = or \ to select another function.
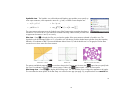
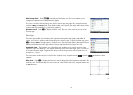
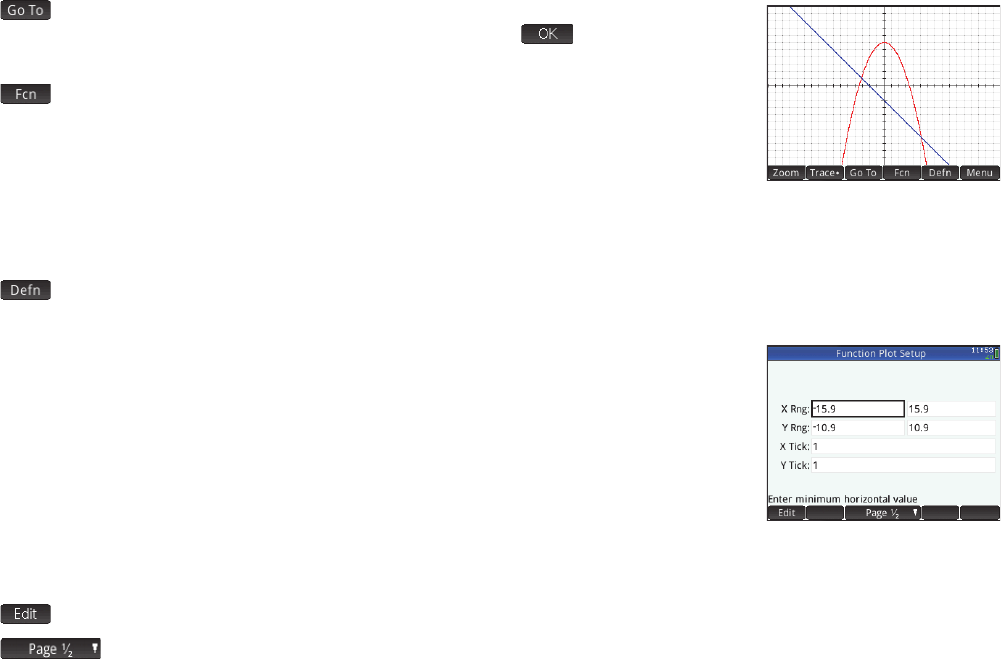
Plot Setup View Press SP to display the Plot Setup view. This view enables you to
configure the appearance of the graphs in Plot view. There are two pages of options. The fields on
the first page are:
• X Rng: the horizontal graphing range (minium and maximum)
• Y Rng: the vertical graphing range (minium and maximum)
• X Tick: horizontal tick mark spacing
• Y Tick: vertical tick mark spacing
The menu items on the first page of this view are:
• : makes the selected value editable. (You can also just tap the field twice.)
• : displays the second page of options