


23
23
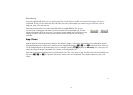
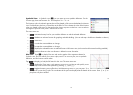
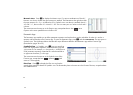
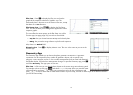
Symbolic view The Symbolic view of the Advanced Graphing app enables you to specify up
to ten open sentences, each expressed in terms of x, y, both, or neither. Some examples are:
The menu items are the same as in the Symbolic view of the Function app, except that here there is
a button for Y as well as for X. If you enter these variables manually, make sure that you enter them
as uppercase characters: X and Y, not x and y.
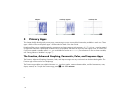
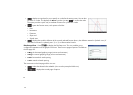
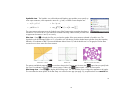
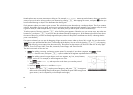
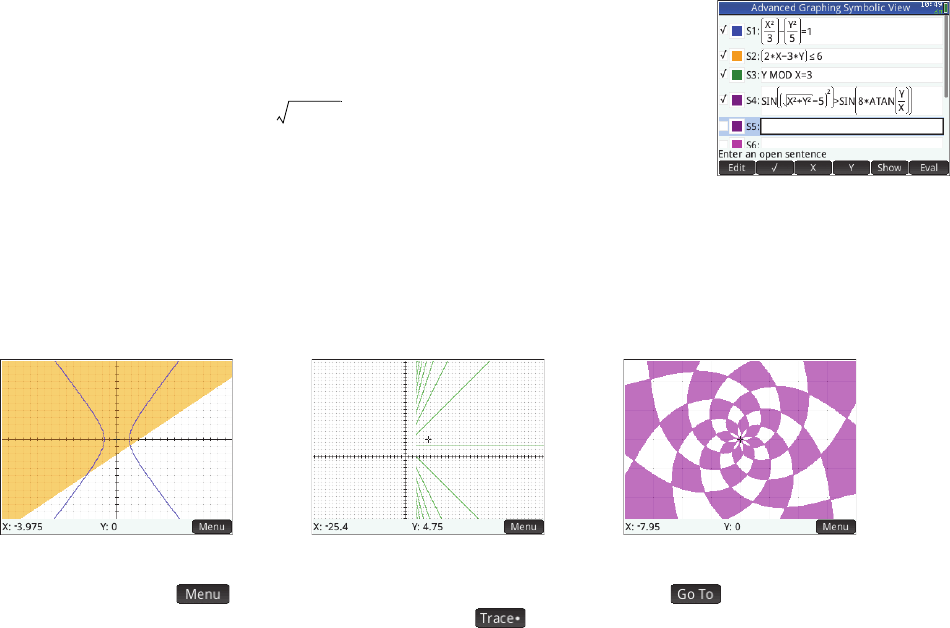
Plot view Press P to display the Plot view and see the graphs of the open sentences selected in Symbolic view. The
hyperbola in the first illustration below is S1 in Symbolic view (see above), and the shaded area indicates where the inequality
defined in S2 evaluates to TRUE. The second illustration below shows S3, and the third shows S4. The graph of S4 has been
zoomed in on to show some of its finer structure.
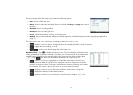
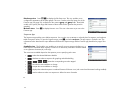
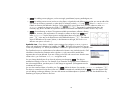
The options available by tapping are similar to those in the Function app. However, the option lets you specify both
the X and Y coordinates of the point you want to jump to. Further, the option opens a menu of trace options.
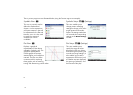
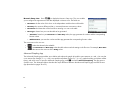
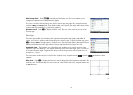
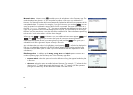
Plot Setup view Press SP to display the Plot Setup view. This view enables you to configure the appearance of graphs.
This view offers the same options as the Plot Setup view of the Function app (see page 13), except that there is no
Method field.
• x
2
/3 – y
2
/5 = 1 •2x – 3y ≤ 6
• y MOD x = 3 •
Definitions S1 and S2 Definition S3 Definition S4 (with axes hidden)
x
2
y
2
+5–
2
sin 8
y
x
----
atan
sin>