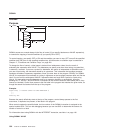
Using the ? prefix, therefore, switches you alternately in or out of interactive debug. (Because the
language processor ignores any further TRACE statements in your program after you are in
interactive debug, use CALL TRACE '?' to turn off interactive debug.)
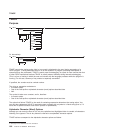
! Inhibits host command execution. During regular execution, a TRACE instruction with a prefix of !
suspends execution of all subsequent host commands. For example, TRACE !C causes commands
to be traced but not processed. As each command is bypassed, the REXX special variable RC is
set to 0. You can use this action for debugging potentially destructive programs. (Note that this
does not inhibit any commands entered manually while in interactive debug. These are always
processed.)
You can switch off command inhibition, when it is in effect, by issuing a TRACE instruction with a
prefix !. Repeated use of the ! prefix, therefore, switches you alternately in or out of command
inhibition mode. Or, you can turn off command inhibition at any time by issuing TRACE O or TRACE
with no options.
Numeric Options
If interactive debug is active and if the option specified is a positive whole number (or an expression that
evaluates to a positive whole number), that number indicates the number of debug pauses to be skipped
over. (See separate section in “Interactive Debugging of Programs” on page 411, for further information.)
However, if the option is a negative whole number (or an expression that evaluates to a negative whole
number), all tracing, including debug pauses, is temporarily inhibited for the specified number of clauses.
For example, TRACE -100 means that the next 100 clauses that would usually be traced are not, in fact,
displayed. After that, tracing resumes as before.
Tracing Tips:
1. When a loop is being traced, the DO clause itself is traced on every iteration of the loop.
2. You can retrieve the trace actions currently in effect by using the TRACE built-in function (see section
“TRACE” on page 195).
3. If available at the time of execution, comments associated with a traced clause are included in the
trace, as are comments in a null clause, if you specify TRACE A, R, I, or S.
4. Commands traced before execution always have the final value of the command (that is, the string
passed to the environment), and the clause generating it produced in the traced output.
5. Trace actions are automatically saved across subroutine and function calls. See the CALL instruction
(page “Purpose” on page 135) for more details.
A Typical Example
One of the most common traces you will use is:
TRACE ?R
/* Interactive debug is switched on if it was off, */
/* and tracing Results of expressions begins. */
Format of TRACE Output
Every clause traced appears with automatic formatting (indentation) according to its logical depth of
nesting and so forth. The language processor may replace any control codes in the encoding of data (for
example, EBCDIC values less than '40'x) with a question mark (?) to avoid console interference. Results (if
requested) are indented an extra two spaces and are enclosed in double quotation marks so that leading
and trailing blanks are apparent.
A line number precedes the first clause traced on any line. If the line number is greater than 99999, the
language processor truncates it on the left, and the ? prefix indicates the truncation. For example, the line
number 100354 appears as ?00354. All lines displayed during tracing have a three-character prefix to
identify the type of data being traced. These can be:
*-* Identifies the source of a single clause, that is, the data actually in the program.
+++ Identifies a trace message. This may be the nonzero return code from a command, the prompt
TRACE
168
CICS TS for VSE/ESA: REXX Guide


