


Chapter 4 Human Machine Interface
© National Instruments Corporation 4-29 BridgeVIEW User Manual
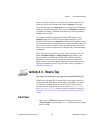
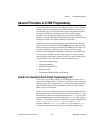
How Do You Display Real-Time Trends?
You can build a real-time trend by dropping a real-time trend indicator on
your front panel and popping up on it to select the HMI G Wizard.
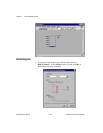
Alternatively, you can assemble the diagram manually using a While Loop
and the Trend Tags VI. Wire the output of the Trend Tags VI to the terminal
for a real-time trend indicator. The Trend Tags VI accepts an array of tag
names, and returns information for a real-time trend you can wire directly
to the real-time trend or Waveform Chart indicator. You can control how
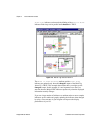
often the trend updates by the time interval control, which, if left unwired,
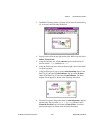
is once per second by default. The scale to % control controls the scale on
the trend. If scale to % is TRUE, the trends return as a percent (%) of full
scale for each tag. If scale to % is FALSE, the trends return in engineering
units. If scale to % is left unwired, trend values return in engineering units,
by default.
The Trend Tags VI always waits the specified time interval. For this reason,
a Trend Tags VI usually is placed in its own While Loop because it controls
the loop execution rate. If you want to execute other VIs at the same rate
that the real-time trend updates, place them in the same loop.
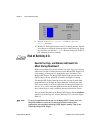
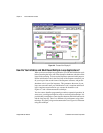
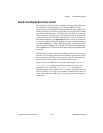
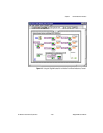
Figure 4-5 shows an HMI with two real-time trend displays. The
Trend
Tank Temperature
displays the trend in percent of full scale, and is
updated every 1.0 second. The
Trend Tank Level
is displayed in
engineering units, and is updated every 2.0 seconds. The tag names passed
into the Trend Tags VI are tag array constants containing the tag names of
interest. Notice that the Trend Tags VI only accepts tag names and not tag
group names.