


Chapter 11 Loops and Charts
BridgeVIEW User Manual 11-18 © National Instruments Corporation
Block Diagram
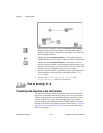
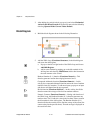
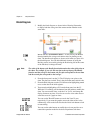
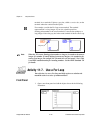
3. Modify the block diagram, as shown in the following illustration,
to display both the average and the current random number on the
same chart.
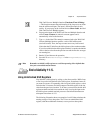
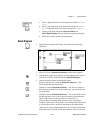
Bundle function (Functions»Cluster)—In this activity, the Bundle
function bundles the average and current value for plotting on the
chart. The bundle node appears as shown at left when you place it in
the block diagram. You can add additional elements by using the
Resizing cursor (accessed by placing the Positioning tool at the corner
of the function) to enlarge the node.
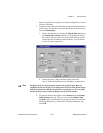
Note
The order of the inputs to the Bundle function determines the order of the plots on
the chart. For example, if you wire the raw data to the top input of the Bundle
function and the average to the bottom, the first plot corresponds to the raw data
and the second plot corresponds to the average.
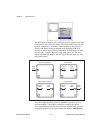
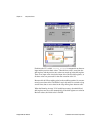
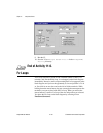
4. From the front panel, run the VI. The VI displays two plots on the
chart. The plots are overlaid. That is, they share the same vertical scale.
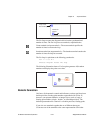
5. From the block diagram, run the VI with execution highlighting turned
on to see the data in the shift registers.
6. Turn execution highlighting off. From the front panel, run the VI.
While the VI is running, use the buttons from the palette to modify the
chart. You can reset the chart, scale the X or Y axis, and change the
display format at any time. You also can scroll to view other areas or
zoom into areas of a graph or chart.
You can use the X and Y buttons to rescale the X and Y axes,
respectively. If you want the graph to autoscale either of the scales
continuously, click on the lock switch to the left of each button to lock
on autoscaling.
You can use the other buttons to modify the axis text precision or to
control the operation mode for the chart. Experiment with these