


Chapter 11 Loops and Charts
© National Instruments Corporation 11-3 BridgeVIEW User Manual
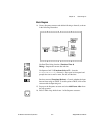
Faster Chart Updates
You can pass an array of multiple values to the chart. The chart treats these
inputs as new data for a single plot. Refer to the
charts.vi
example
located in
G Examples\General\Graphs\charts.llb.
Overlaid Versus Stacked Plots
You can display multiple plots on a chart using a single vertical scale,
called overlaid plots, or using multiple vertical scales, called stacked plots.
Refer to the
charts.vi
example located in
G Examples\General\
Graphs\charts.llb.
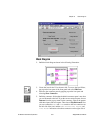
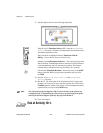
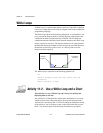
Activity 11-1. Experiment with Chart Modes
Your objective is to view a chart as your VI runs in strip chart mode, scope
chart mode, and sweep chart mode.
1. Open
Charts.vi
, located in the following directory:
BridgeVIEW\
Examples\G Examples\General\Graphs\charts.11b.
2. Run the VI.
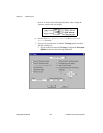
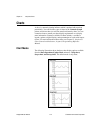
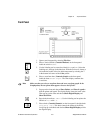
The strip chart mode has a scaling display similar to a paper tape strip
chart recorder. As each new value is received, it is plotted at the right
margin and old values shift to the left.
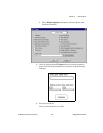
The scope chart mode has a retracing display similar to an
oscilloscope. As the VI receives each new value, it plots the value to
the right of the last value. When the plot reaches the right border of the
plotting area, the VI erases the plot and begins plotting again from the
left border. The scope chart is significantly faster than the strip chart
because it is free of the processing overhead involved in scrolling.
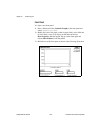
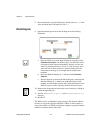
The sweep chart mode acts much like the scope chart, but it does not
go blank when the data hits the right border. Instead, a moving vertical
line marks the beginning of new data and moves across the display as
the VI adds new data.
3. With the VI still running, pop up on any chart, and select Update
Mode, and change the current mode to that of another chart. Notice the
difference between the various charts and modes.
4. Stop and close the VI.
End of Activity 11-1.