


Chapter 11 Loops and Charts
© National Instruments Corporation 11-19 BridgeVIEW User Manual
buttons to explore their operation, scroll the area displayed, or zoom in
on areas of the chart.
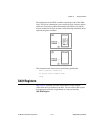
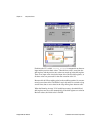
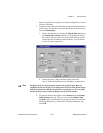
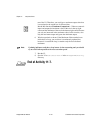
7. Format the scales of the waveform chart to represent either absolute or
relative time. To select the x scale time format, pop up on the x-scale
and select Formatting….
a. Choose absolute time by selecting the Time & Date option from
the Format and Precision menu ring. This changes the dialog
box to the one shown below. For the waveform chart to start at a
certain time and increment at certain intervals, you can edit the
Xo and dX values respectively.
b. Format the chart to display the data starting from noon,
Oct. 24, 1996, and increment every 10 minutes, as shown above.
Note Modifying the axis text format often requires more physical space than was
originally set aside for the axis. If you change the axis, the text may become larger
than the maximum size that the waveform can correctly present. To correct this,
use the Resizing cursor to make the display area of the chart smaller.
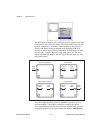
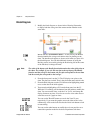
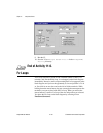
8. To select the relative time format, select Numeric from the Format
and Precision menu ring. Then you can select the Relative Time
(seconds) option in the dialog box and represent the time in seconds.
Modify the dialog box, as shown in the following illustration, and
select OK.