


Chapter 12 Case and Sequence Structures and the Formula Node
© National Instruments Corporation 12-13 BridgeVIEW User Manual
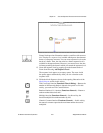
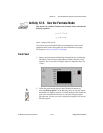
Activity 12-3. Use the Formula Node
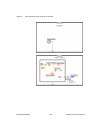
Your objective is to build a VI that uses the Formula Node to calculate the
following equations.
where
x
ranges from 0 to 10.
You will use only one Formula Node for both equations, and you will
graph the results on the same graph. For more information on graphs,
see Chapter 14, Arrays, Clusters, and Graphs.
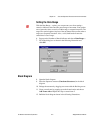
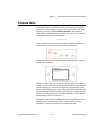
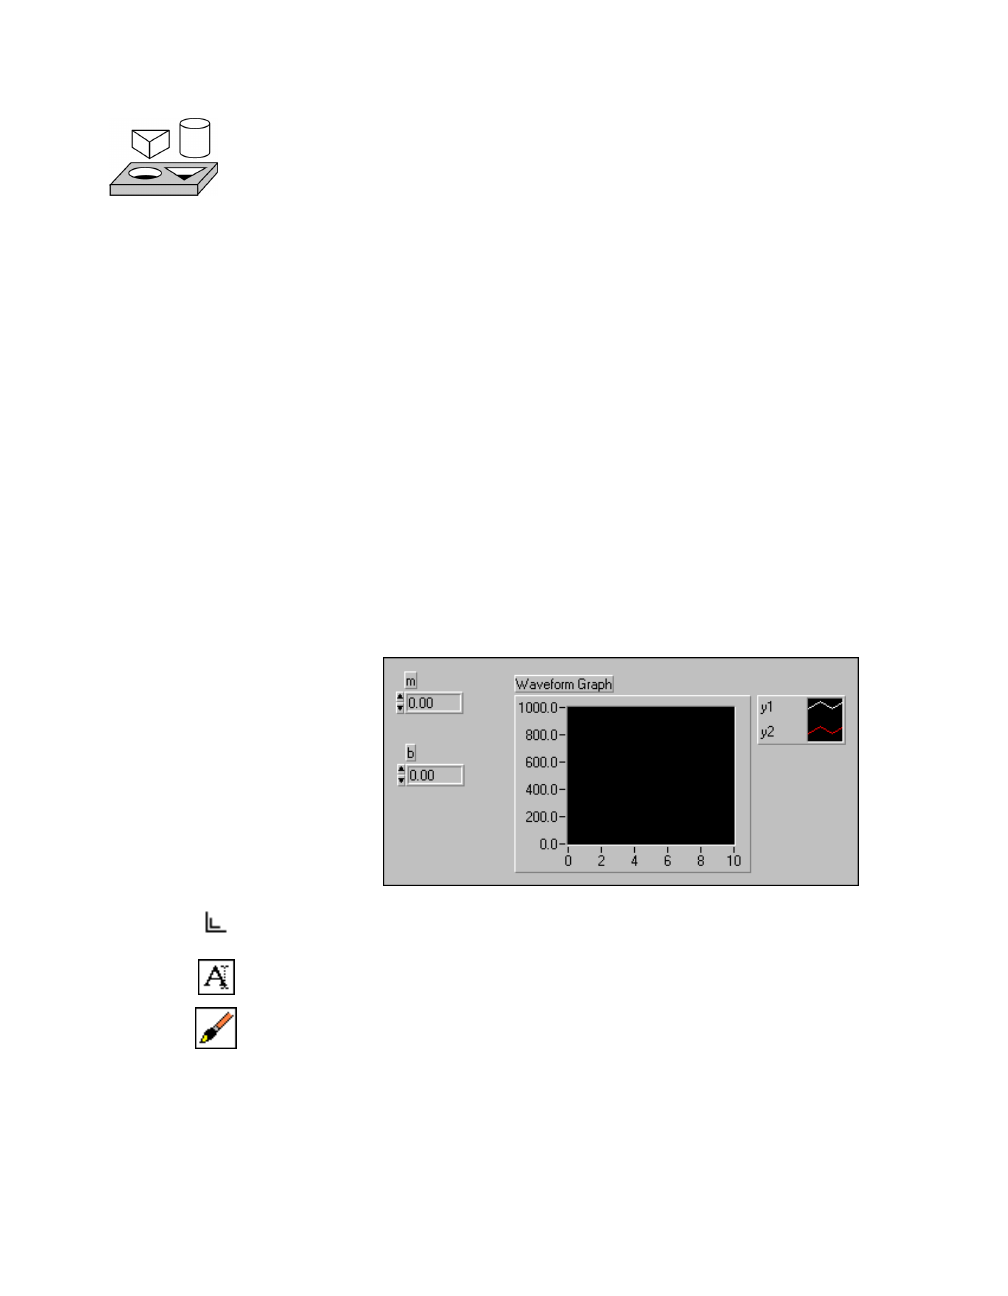
Front Panel
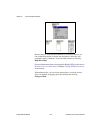
1. Open a new front panel and build the front panel shown in following
illustration. The waveform graph indicator displays the plots of the
equation. The VI uses the two digital controls to input the values for
m
and
b
.
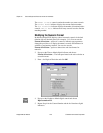
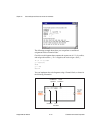
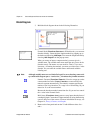
2. Create the graph legend shown in the following illustration by
selecting Show»Legend. Use the Resizing cursor to drag the legend
downward so it displays two plots. Use the Labeling tool to rename the
plots. You can define the line style for each plot using the legend
pop-up menu. You also can color each plot by using the Color tool on
the plots legend.
y
1
x
3
x
2
5+–=
y
2
mxb+×=