


Chapter 11 Loops and Charts
© National Instruments Corporation 11-23 BridgeVIEW User Manual
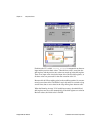
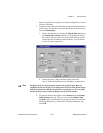
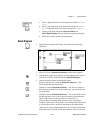
a. Place a digital indicator on the front panel and label it
Maximum
Value
.
b. Place a waveform chart on the front panel and label it
Random
Data
. Change the scale of the chart to range from
0.0
to
1.0
.
c. Pop up on the chart and choose Show»Scrollbar and
Show»Digital Display. Pop up and hide the palette and legend.
d. Resize the scrollbar with the positioning tool.
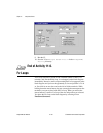
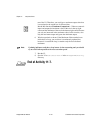
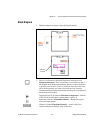
Block Diagram
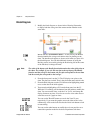
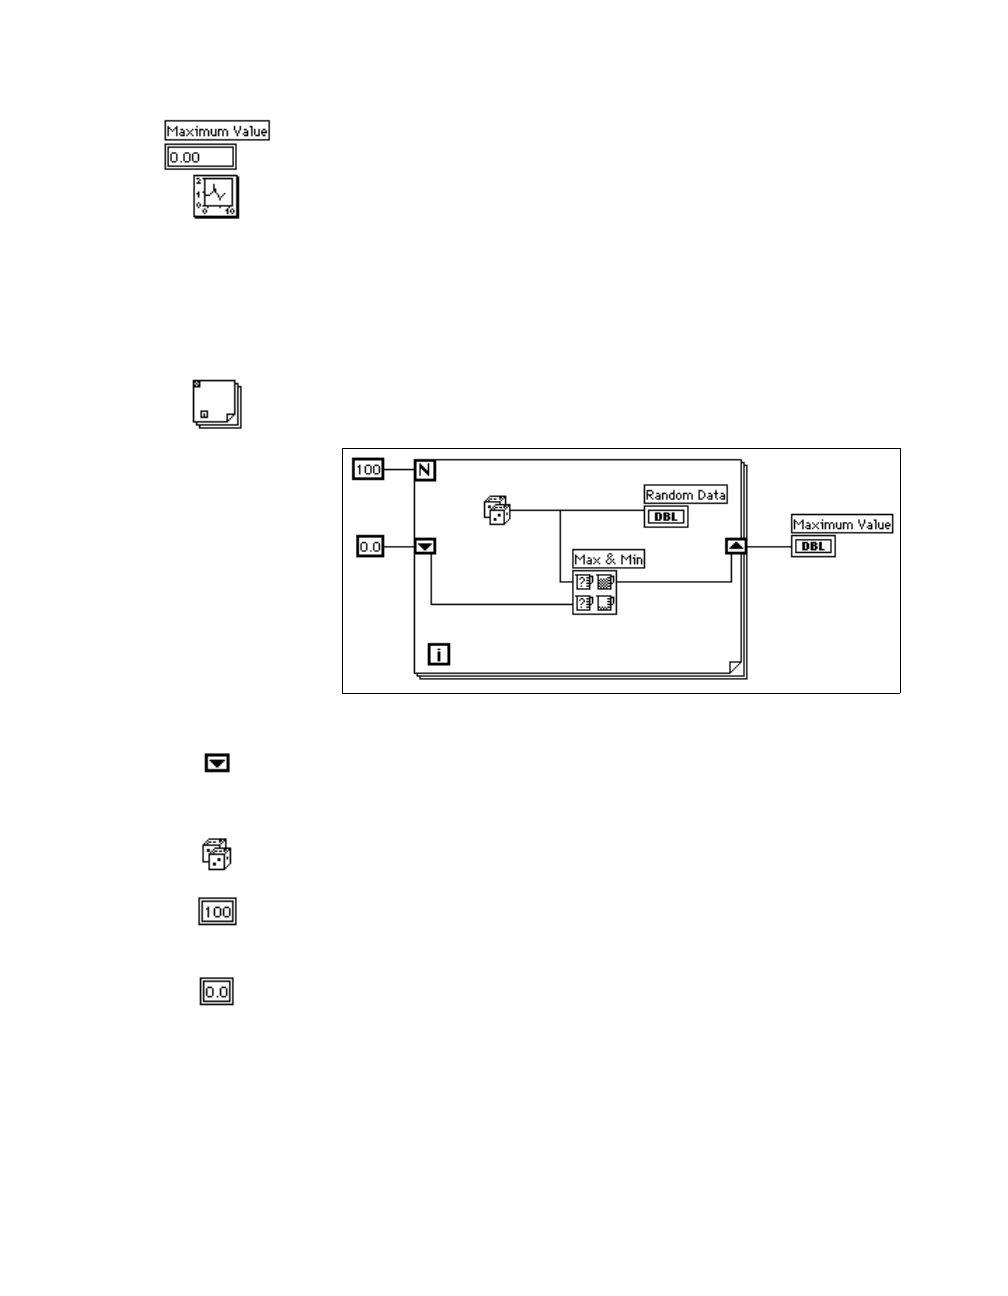
2. Open the block diagram and modify it as shown in the following
illustration.
3. Place a For Loop (Functions»Structures) on the block diagram.
4. Add the shift register by popping up or right-clicking on the right or
left border of the For Loop and choosing Add Shift Register.
5. Add the following objects to the block diagram.
Random Number (0–1) function (Functions»Numeric)—This
function generates the random data.
Numeric Constant (Functions»Numeric)—The For Loop needs to
know how many iterations to make. In this case, you execute the For
Loop 100 times.
Numeric Constant (Functions»Numeric)—You set the initial value of
the shift register to zero for this exercise because you know that the
output of the random number generator is from 0.0 to 1.0.
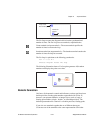
You must know something about the data you are collecting to
initialize a shift register. For example, if you initialize the shift register
to 1.0, then that value is already greater than all the expected data
values, and is always the maximum value. If you did not initialize the
shift register, then it would contain the maximum value of a previous