


Chapter 11 Loops and Charts
© National Instruments Corporation 11-5 BridgeVIEW User Manual
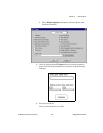
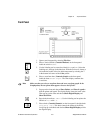
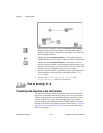
Front Panel
1. Open a new front panel by selecting File»New.
2. Place a Vertical Switch (Controls»Boolean) on the front panel.
Label the switch
Enable
.
3. Use the Labeling tool to create free labels for
ON
and
OFF
. Select the
Labeling tool, and type in the label text. With the Color tool, shown at
left, make the border of the free label transparent by selecting the T
in the bottom left corner of the Color palette.
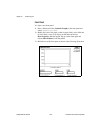
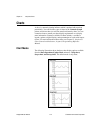
4. Place a waveform chart (Controls»Graph) on the front panel.
Label the chart
Random Signal
. The chart displays random data
in real time.
Note
Make sure that you select a waveform chart and not a waveform graph. In the
Graph palette, the waveform chart appears closest to the left side.
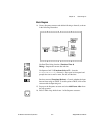
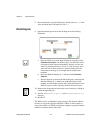
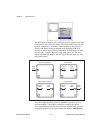
5. Pop up on the chart and choose Show»Palette, and Show»Legend to
hide the palette and legend. The digital display shows the latest value.
Then pop up on the chart and choose Show»Digital Display and
Show»Scroll Bar.
6. Rescale the chart from
0.0
to
1.0
. Use the Labeling tool to replace the
HI limit of
10.0
with
1.0
.
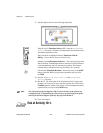
7. Place a knob (Controls»Numeric) on the front panel. Label the knob
Loop Delay (sec)
. This knob controls the timing of the While
Loop. Pop up on the knob and deselect Show»Digital Display to hide
the digital display.