


Chapter 14 Arrays, Clusters, and Graphs
© National Instruments Corporation 14-19 BridgeVIEW User Manual
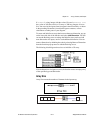
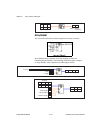
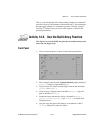
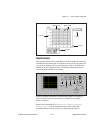
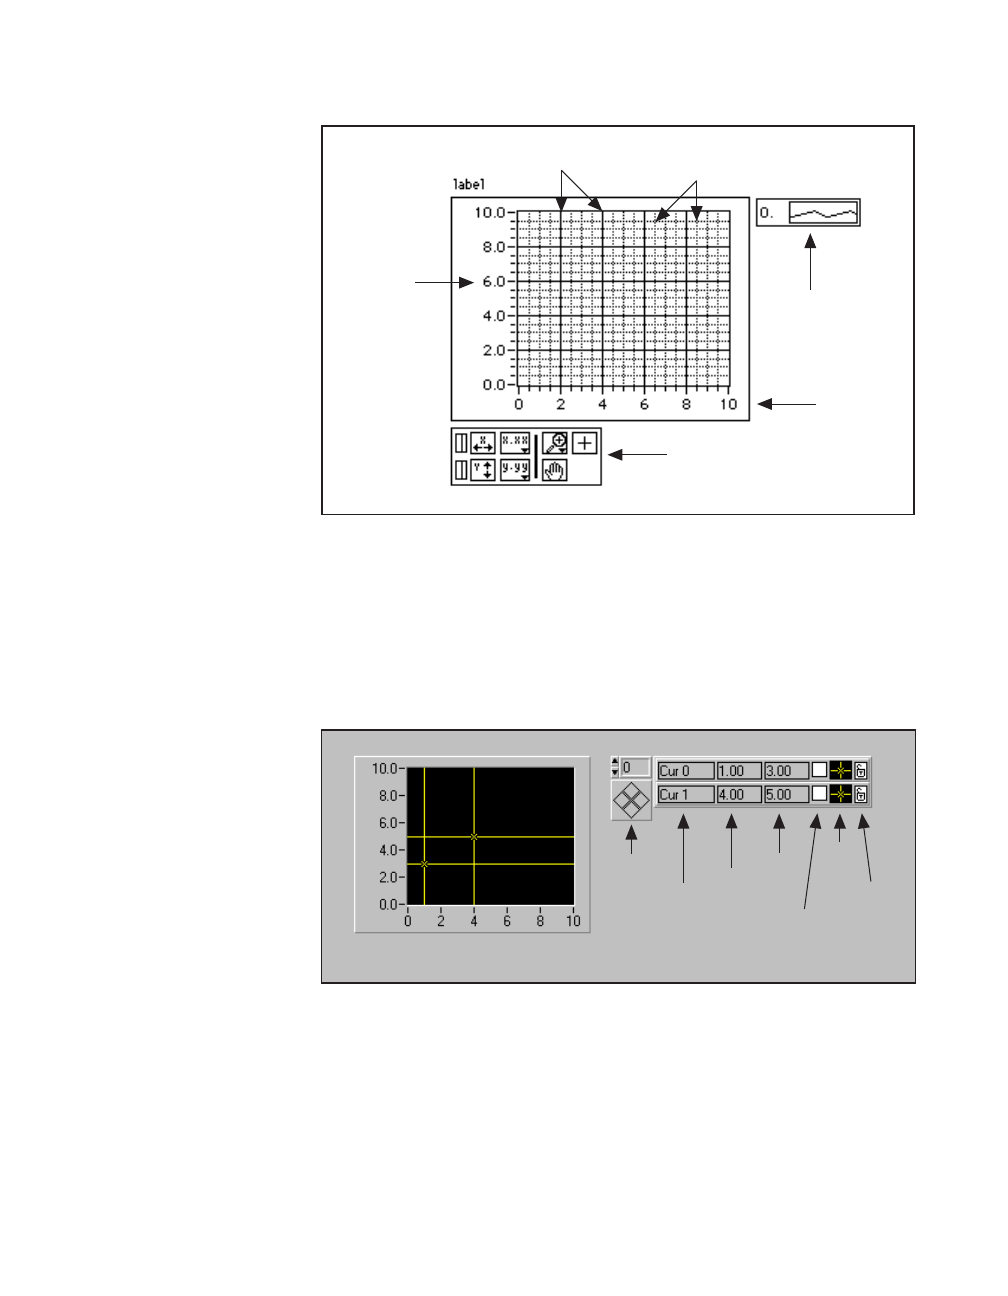
Graph Cursors
You can place cursors and a cursor display on all the graphs in G, and you
can label the cursor on the plot. You can set a cursor to lock onto a plot, and
you can move multiple cursors at the same time. There is no limit to the
number of cursors a graph can have. The following illustration shows a
waveform graph with the cursor display.
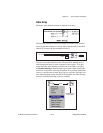
For more detailed information on customizing graphs, see Chapter 15,
Graph and Chart Controls and Indicators, in the G Programming
Reference Manual.
Refer to the ZoomGraph VI in
Examples\G Examples\General\
Graphs\zoom.llb
for an example that reads cursor values and
programmatically zooms in and out of a graph using the cursors.
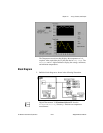
Major Grids
Minor Grids
Legend
Palette
X Scale
Y Scale
Cursor
Movement
Control
X Position
Active
Cursor Button
for Cursor
Movement
Lock
to Plot
Control
Cursor
Name
Y Position
Cursor
Style
Control