


M306H7T3-RPD-E User’s Manual 3. Usage (How to Use the Emulator Debugger)
REJ10J0964-0100 Rev.1.00 August 01, 2005 Page 67 of 88
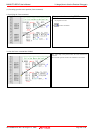
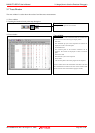
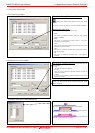
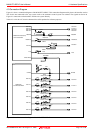
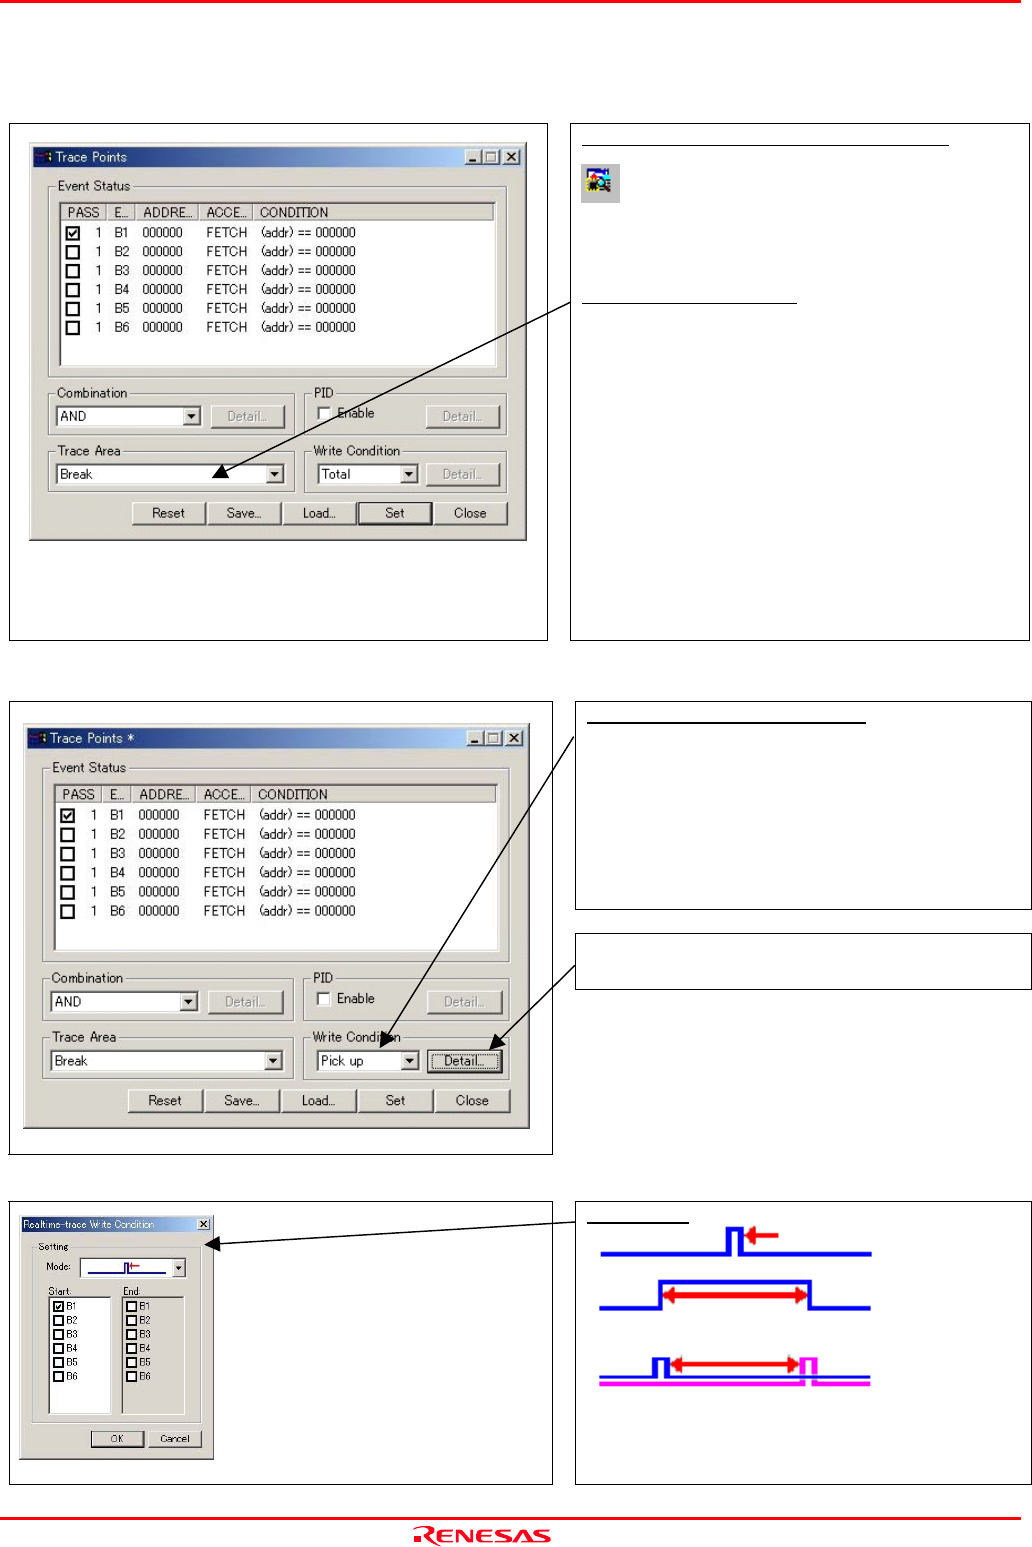
(3) Trace point setup window
1) Trace point setup window
Trace Point Setting Window in initial state
Clicking this toolbar button opens the trace point setting
window.
You can set events in the same way as for the hardware breakpoints.
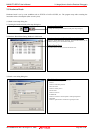
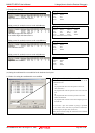
Specifying a trace range
You can specify a trace range for the trace event.
- Break
32K cycles of instruction execution before the user program
stopped is recorded.
- Before
32K cycles of instruction execution before a trace point
condition was met is recorded.
- About
16K cycles of instruction execution before and after a trace point
condition was met is recorded.
- After
32K cycles of instruction execution after a trace point condition
was met is recorded.
- Full
32K cycles of instruction execution after a trace began is
recorded.
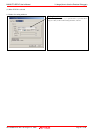
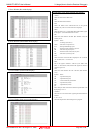
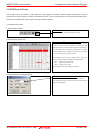
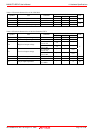
2) Setting the trace write condition
Setting the trace write condition
You can specify a condition for the cycles to be written into the
trace memory.
- Total
All cycles are written into memory.
- Pick up
Only the cycles in which the specified condition was met are
written into memory.
- Exclude
Only the cycles in which the specified condition was not met are
written into memory.
When you have finished setting the trace write condition, click this
button. The Realtime-trace Write Condition dialog box shown
below will appear.
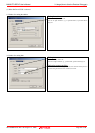
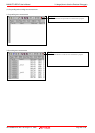
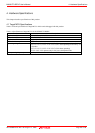
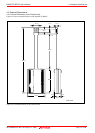
3) Realtime trace Write Condition dialog box
Write mode
Only the cycle in which the specified Start event occurred
A range of cycles from when the specified Start event occurred to
when the specified Start event became nonexistent.
A range of cycles from when the specified Start event occurred to
when the specified End event occurred.