


4-17
Using the Web Browser Interface
Status Reporting Features
Using the Web Browser
Interface
Note When troubleshooting the sources of alerts, it may be helpful to check the
switch’s Port Status and Port Counter windows and the Event Log in the
console interface.
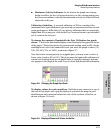
Viewing Detail Views of Alert Log Entries
By double clicking on Alert Entries, the web browser interface displays a
Detail View or separate window detailing information about the events. The
Detail View contains a description of the problem and a possible solution. It
also provides four management buttons:
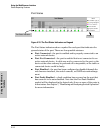
■ Acknowledge Event – removes the New symbol from the log entry
■ Delete Event – removes the alert from the Alert Log
■ Cancel Button – closes the detail view with no change to the status of
the alert and returns you to the Overview screen.
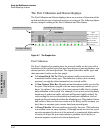
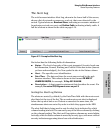
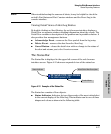
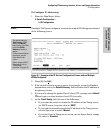
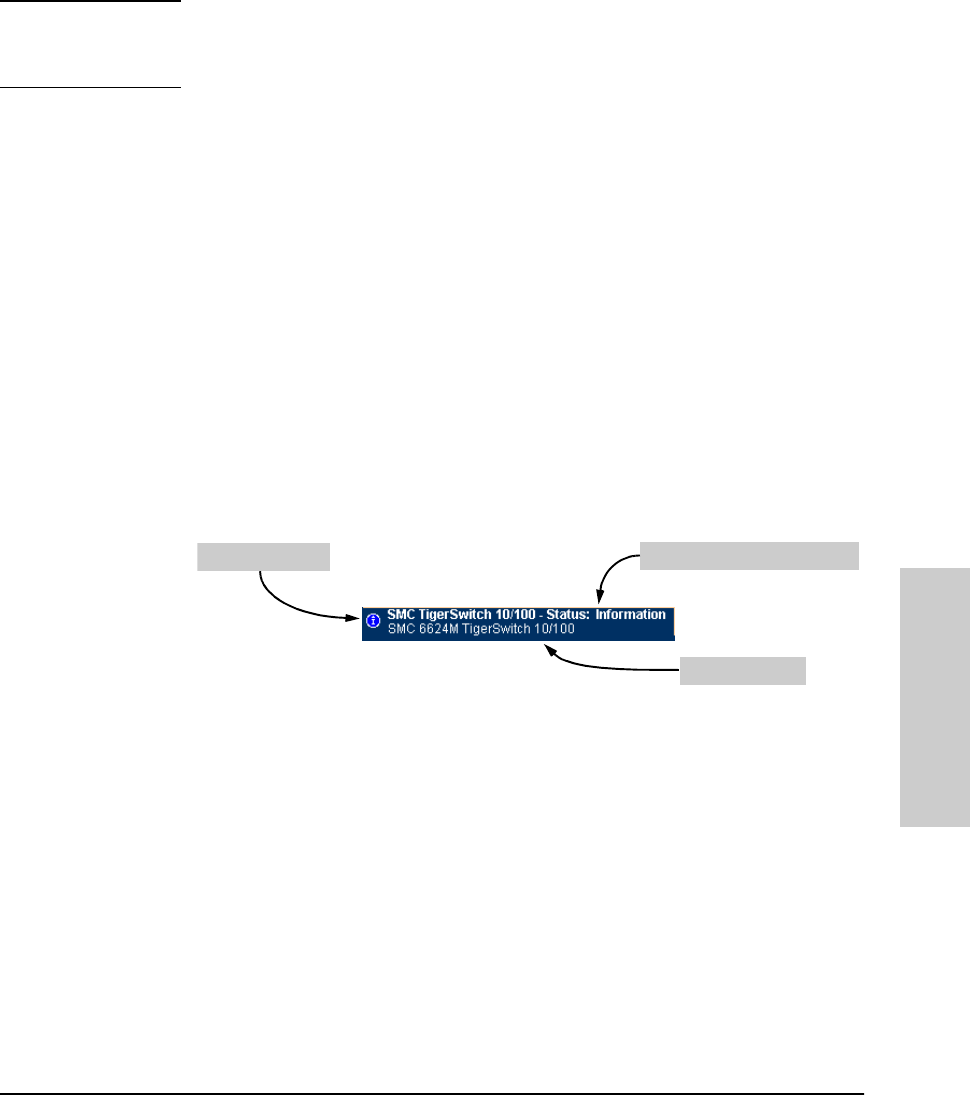
The Status Bar
The Status Bar is displayed in the upper left corner of the web browser
interface screen. Figure 4-12 shows an expanded view of the status bar.
Figure 4-12. Example of the Status Bar
The Status bar consists of four objects:
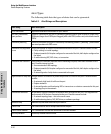
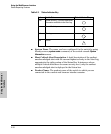
■ Status Indicator. Indicates, by icon, the severity of the most critical alert
in the current display of the Alert Log. This indicator can be one of three
shapes and colors as shown in the following table.
Status Indicator
Most Critical Alert Description
Product Name