


Appendix B: Algorithms
B–2
TDS 500C, TDS 600B, & TDS 700C User Manual
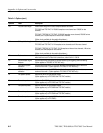
Histogram Method — attempts to find the highest density of points above and
below the waveform midpoint. It attempts to ignore ringing and spikes when
determining the 0% and 100% levels. This method works well when measuring
square waves and pulse waveforms.
The oscilloscope calculates the histogram-based High and Low values as
follows:
1. It makes a histogram of the record with one bin for each digitizing level (256
total).
2. It splits the histogram into two sections at the halfway point between Min
and Max (also called Mid).
3. The level with the most points in the upper histogram is the High value, and
the level with the most points in the lower histogram is the Low value.
(Choose the levels where the histograms peak for High and Low.)
If Mid gives the largest peak value within the upper or lower histogram, then
return the Mid value for both High and Low (this is probably a very low
amplitude waveform).
If more than one histogram level (bin) has the maximum value, choose the
bin farthest from Mid.
This algorithm does not work well for two-level waveforms with greater than
about 100% overshoot.
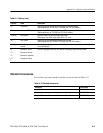
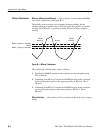
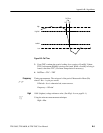
The user sets the various reference levels, through the Reference Level selection
of the Measure menu. They include:
HighRef — the waveform high reference level. Used in fall time and rise time
calculations. Typically set to 90%. You can set it from 0% to 100% or to a
voltage level.
MidRef — the waveform middle reference level. Typically set to 50%. You can
set it from 0% to 100% or to a voltage level.
HighRef, MidRef, LowRef,
Mid2Ref