


Prestige 660H/HW Series User’s Guide
213 Chapter 19 Maintenance
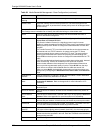
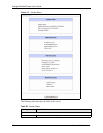
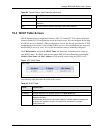
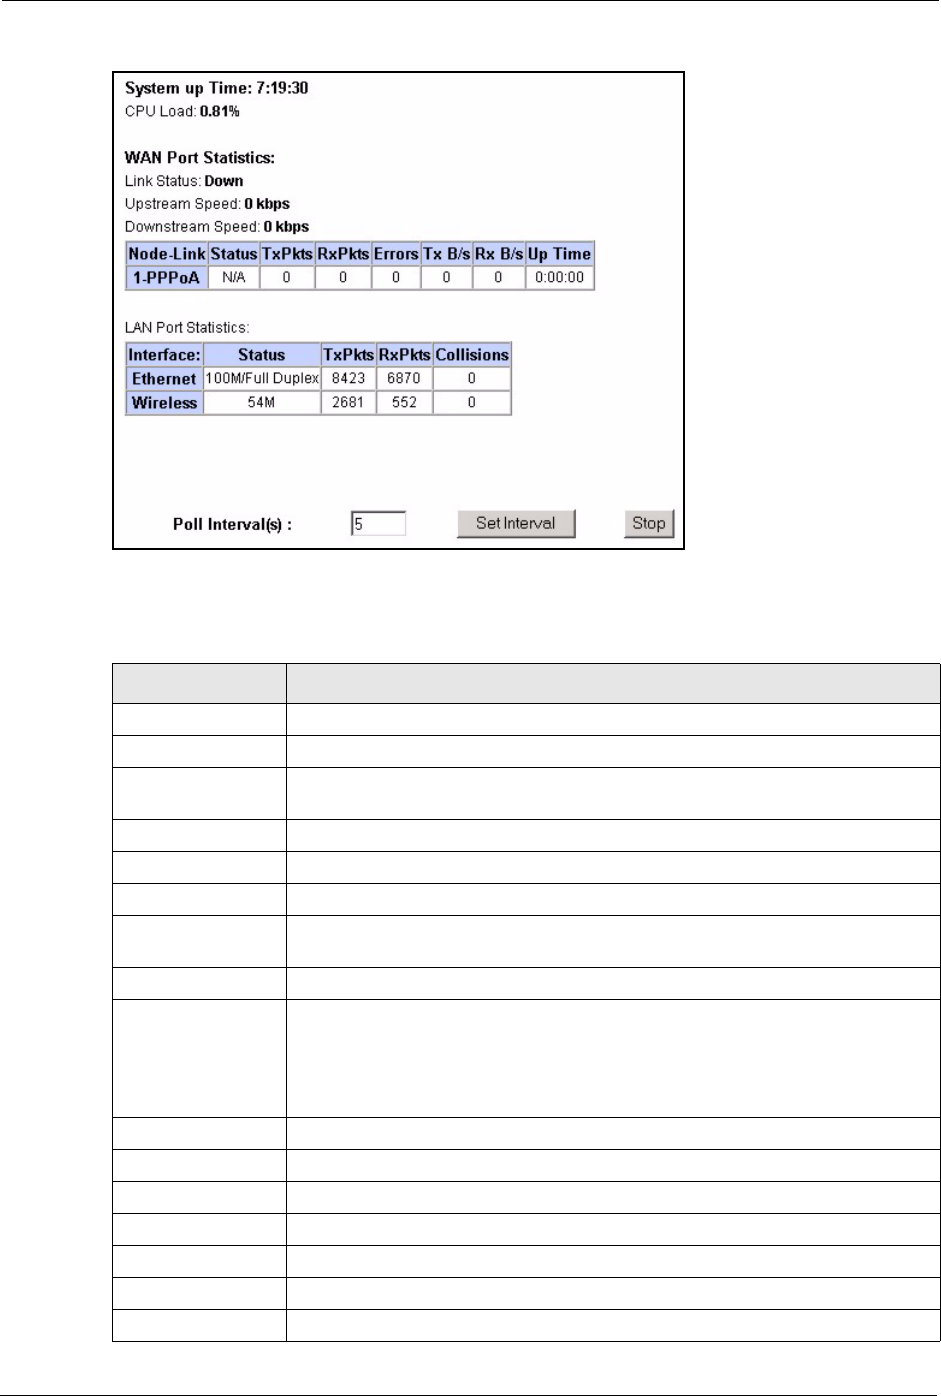
Figure 112 System Status: Show Statistics
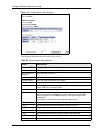
The following table describes the fields in this screen.
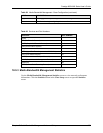
Table 64 System Status: Show Statistics
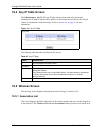
LABEL DESCRIPTION
System up Time This is the elapsed time the system has been up.
CPU Load This field specifies the percentage of CPU utilization.
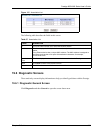
LAN or WAN Port
Statistics
This is the WAN or LAN port.
Link Status This is the status of your WAN link.
Upstream Speed This is the upstream speed of your Prestige.
Downstream Speed This is the downstream speed of your Prestige.
Node-Link This field displays the remote node index number and link type. Link types are
PPPoA, ENET, RFC 1483 and PPPoE.
Interface This field displays the type of port.
Status For the WAN port, this displays the port speed and duplex setting if you're using
Ethernet encapsulation and down (line is down), idle (line (ppp) idle), dial
(starting to trigger a call) and drop (dropping a call) if you're using PPPoE
encapsulation.
For a LAN port, this shows the port speed and duplex setting.
TxPkts This field displays the number of packets transmitted on this port.
RxPkts This field displays the number of packets received on this port.
Errors This field displays the number of error packets on this port.
Tx B/s This field displays the number of bytes transmitted in the last second.
Rx B/s This field displays the number of bytes received in the last second.
Up Time This field displays the elapsed time this port has been up.
Collisions This is the number of collisions on this port.