


Port RMON
186 Avaya Integrated Management Release 4.0.1 Software Update Manager
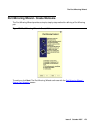
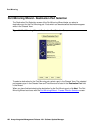
The Port RMON window includes three sections. At the top of the window is a pie chart. In the
center of the window is a graph. At the bottom of the window is a list of traffic types.
The Pie Chart
The pie chart shows the relative amounts of Unicast and Non-Unicast traffic on a selected port.
The legend to the right of the pie chart shows the color representing each of the traffic types.
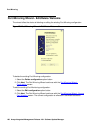
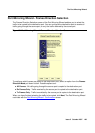
The Traffic Graph
The graph charts various traffic types over time. Each traffic type is represented by a different
colored line. Using the mouse, you can view traffic statistics, zoom in or out of the graph, and
scroll within the graph to view parts of the graph that are currently hidden.
When changing the view on the graph, the graph freezes. To unfreeze the graph and restore the
display to the default display, click on the graph.
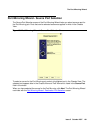
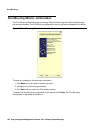
Viewing Traffic Statistics
To view traffic statistics, hold the mouse over a point on the graph representing the traffic for
which you would like to see statistics. After two seconds, an info box opens displaying the name
of the traffic type represented by the line in the graphic, and the traffic rate at the selected point.
Zooming In and Out of the Graph
To zoom out and view a graph of all the traffic on the selected port from the time the application
was opened, double-click the graph. The graph is compressed to show all of the traffic on the
port from the time the application was opened until the present time.
To zoom in on a portion of the graph, press SHIFT and select a portion of the graph using the
mouse. The graph zooms in and shows only the portion of the graph that was selected.