


101
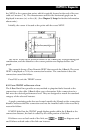
the NEXT at the connection point, which is typically located at the end of the test
cable at 2 meters (7 ft). The measurement unit for the horizontal graph can be
displayed in meters (m) or feet (ft). (See Chapter 3, Setup for further information
about units.)
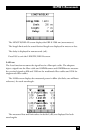
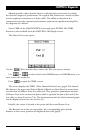
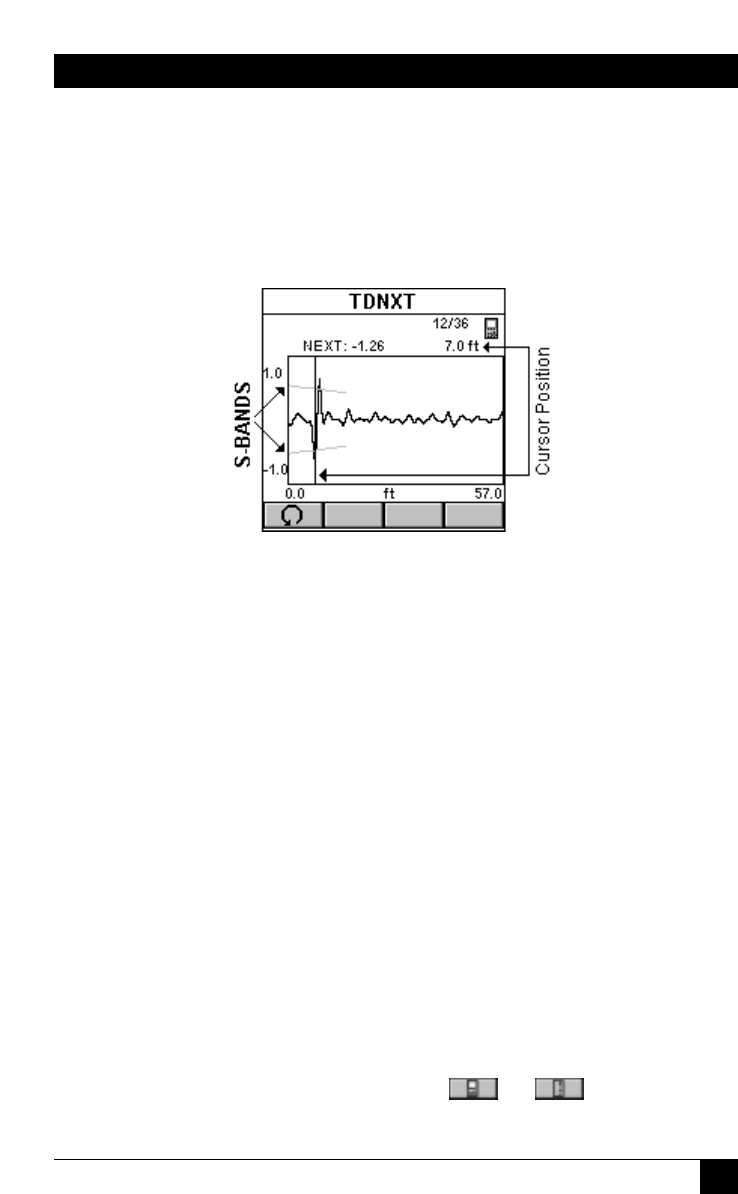
Initially, the cursor is located at the point with the worst NEXT.
The NEXT at the cursor position relative to the S-Band, the corresponding pair
combination, and the distance to the cursor position are displayed above the
graph.
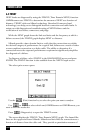
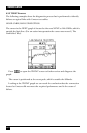
The example shows a Time Domain NEXT that exceeds the S-Bands. The worst
NEXT is displayed at 7.0 ft, the connection location. The conclusion is that the
connection caused the failure.
Press ESC to exit the TDNXT screen.
6.3.1 U
SING
TDNXT
TO
D
IAGNOSE A
L
INK
The S-Band limit lines provide an easy method to pinpoint faults located at the
connection or the cable. S-Bands allow you to determine if the connections in a
link meet the desired performance level. They are designed to match the standard
category of the selected Autotest.
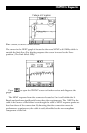
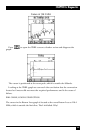
A graph containing peaks that are located outside the S-bands at the connection
distance indicates that the connection and not the installed cable is the most likely
reason for failure.
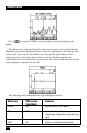
If NEXT failed but the TDNXT graph displays peaks within the S-Bands at the
connection distance, the fault is caused by the cable portion of the link.
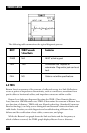
If failures occur at both ends of the link, use or to diagnose each
end. Failures at both ends of the link can interact.
CHAPTER 6: Diagnostics