105
S-Bands provide a time domain limit to verify that the connections are within
the desired category of performance. In a typical link, failures are a result of either
a non-compliant connection or a faulty cable. The ability to determine if a
connection meets the expected performance requirement significantly simplifies
the diagnosis of a failure.
Select TDRL in the DIAGNOSTICS screen and press ENTER. The TDRL
function is also available from the RETURN LOSS Graph screen.
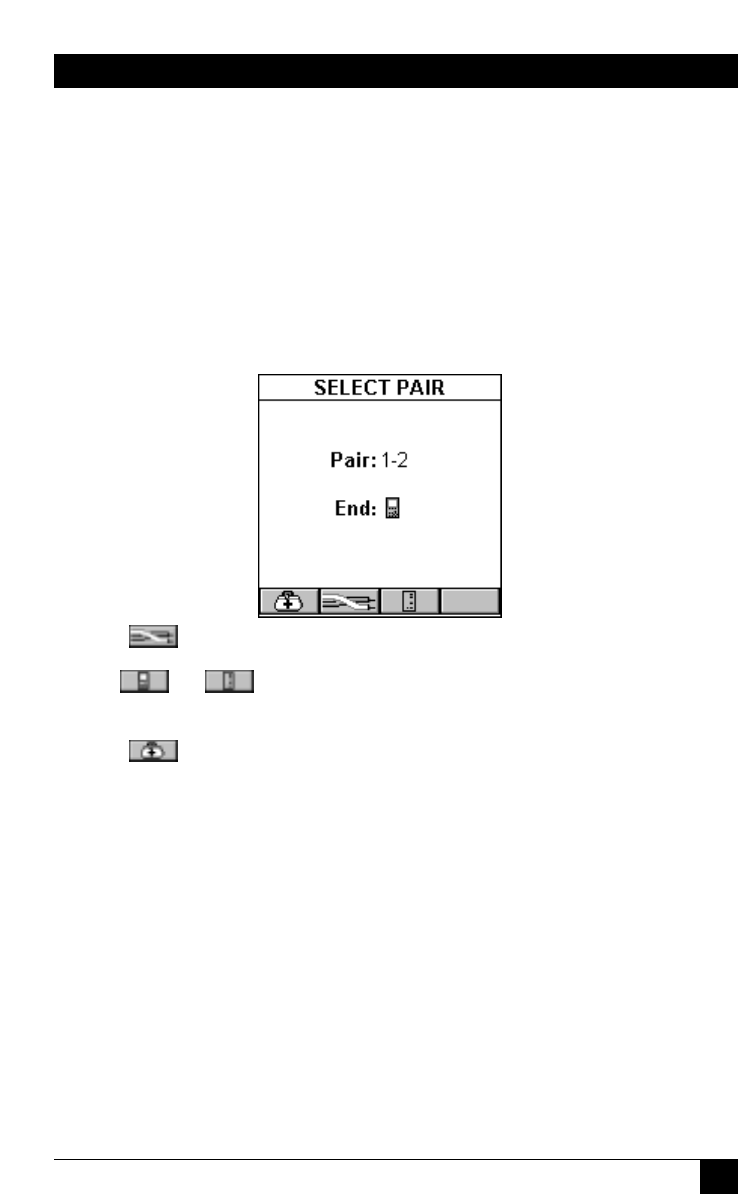
The Select Pair screen opens.
Use the (Pair) function key to select the Pair you want to analyze.
Use or to select which end, OMNIScanner or OMNIRemote, you
want to view the results for.
Press to open the TDRL screen.
The screen displays the TDRL (Time Domain Return Loss) graph. The funnel-
like lines are the upper and lower S-Bands. S-Bands are limit lines for connections
as a function of distance from the cable end. They provide a quantitative measure
of Return Loss at the connection point, which is typically located at the end of the
test cable, at about 2 meters (7 ft). The measurement unit for the horizontal graph
can be displayed in meters (m) or feet (ft.).
Initially, the cursor is located at the point with the worst Return Loss.
The Return Loss at the cursor position, the corresponding pair, and the
distance to the cursor position are displayed above the graph.
CHAPTER 6: Diagnostics
