


Monitoring Tools 12-5
GG
GG
ee
ee
nn
nn
ee
ee
rr
rr
aa
aa
ll
ll
SS
SS
tt
tt
aa
aa
tt
tt
ii
ii
ss
ss
tt
tt
ii
ii
cc
cc
ss
ss
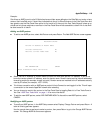
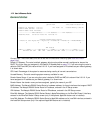
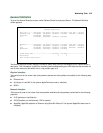
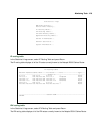
To go to the General Statistics screen, select General Statistics and press Return. The General Statistics
screen appears.
The General Statistics screen displays information about data traffic on the Netopia R5000 Series Router’s
data ports. This information is useful for monitoring and troubleshooting your LAN. Note that the counters roll
over at their maximum field width, that is, they restart again at 0.
PP
PP
hh
hh
yy
yy
ss
ss
ii
ii
cc
cc
aa
aa
ll
ll
II
II
nn
nn
tt
tt
ee
ee
rr
rr
ff
ff
aa
aa
cc
cc
ee
ee
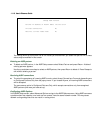
The top left side of the screen lists total packets received and total packets transmitted for the following data
ports:
■ Ethernet Hub
■ Aux Async or LocalTalk (if the optional AppleTalk feature set is installed)
■ SDSL 1
NN
NN
ee
ee
tt
tt
ww
ww
oo
oo
rr
rr
kk
kk
II
II
nn
nn
tt
tt
ee
ee
rr
rr
ff
ff
aa
aa
cc
cc
ee
ee
The bottom left side of the screen lists total packets received and total packets transmitted for the following
protocols:
■ IP (IP packets on the Ethernet)
■ IPX (IPX packets on the Ethernet) if IPX is enabled
■ AppleTalk (AppleTalk packets on Ethernet using EtherTalk Phase II if the optional AppleTalk feature set is
installed)
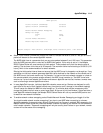
General Statistics
Phys I/F---------Rx Bytes---Tx Bytes---Rx Pkts---Tx Pkts----Rx Err----Tx Err
Ethernet Hub 123456789 123456789 12345678 12345678 12345678 12345678
Aux Async 123456789 123456789
T1 1 123456789 123456789 12345678 12345678
Network----------Rx Bytes---Tx Bytes---Rx Pkts---Tx Pkts----Rx Err----Tx Err
IP 123456789 123456789 12345678 12345678 12345678 12345678
IPX 123456789 123456789 12345678 12345678 12345678 12345678
AppleTalk 123456789 123456789 12345678 12345678
Frame Relay LMI------------------------Rx Pkts---Tx Enqs--------------------
LMI Status 0 0
DLCI Traffic Statistics...