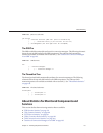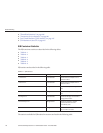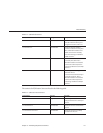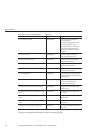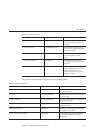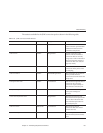
TABLE18–3 EJB SessionStore Statistics (Continued)
AttributeName DataType Description
activationErrorCount CountStatistic Time(ms) spent executing the
method for thelast
successful/unsuccessful attempt to
execute the operation.This is
collected for statelessand stateful
session beans andentity beans, if
monitoring is enabledon the EJB
container.
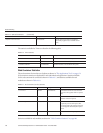
passivationCount CountStatistic Number ofsessions passivated
(inactivated) using thisstore.
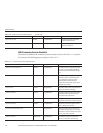
passivationSuccessCount CountStatistic Number of sessions successfully
passivated using thisstore.
passivationErrorCount CountStatistic Numberof sessions that could notbe
passivated using thisstore.
expiredSessionCount CountStatistic Number of expired sessions that
were removed bythis store.
passivatedBeanSize CountStatistic Totalnumber of bytes passivatedby
this store, includingtotal, minimum,
and maximum.
passivationTime CountStatistic Timespent on passivating beansto
the store, includingthe total,
minimum, and maximum.
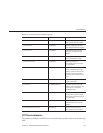
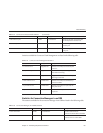
checkpointCount (enterprise prole only) CountStatistic Number of sessions checkpointed
using this store.
checkpointSuccessCount (enterprise prole
only)
CountStatistic Number of sessions checkpointed
successfully.
checkpointErrorCount (enterprise prole
only)
CountStatistic Number of sessions that couldn't be
checkpointed.
checkpointedBeanSize (enterprise prole
only)
ValueStatistic Total number ofbytes checkpointed
by the store.
checkpointTime enterprise prole only) TimeStatistic Time spent oncheckpointing beans
to the store.
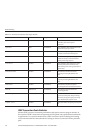
The statistics available for EJB pools are listed in the following table.
AboutMonitoring
SunGlassFishEnterpriseServer2.1AdministrationGuide • December2008178


