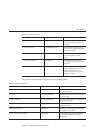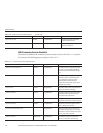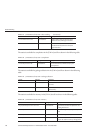
TABLE18–15 Transaction ServiceStatistics (Continued)
Statistic DataType Description
committedcount CountStatistic Number of transactionsthat have been
committed.
rolledbackcount CountStatistic Numberof transactions that have been
rolled back.
state StringStatistic Indicates whetheror not the transaction
has been frozen.
Java Virtual Machine (JVM) Statistics
The JVM has monitorable attributes that are always enabled. The statistics available for the
JVM are shown in the following table.
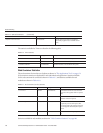
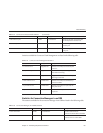
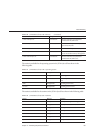
TABLE18–16 JVM Statistics
Statistic DataType Description
heapsize BoundedRangeStatistic Theresident memory footprintwith the
higher and lowerbounds of the JVM’s
memory heap size.
uptime CountStatistic The amount oftime the JVM has been
running.
JVM Statistics in Java SE
With Java SE, additional monitoring information can be obtained from the JVM. Set the
monitoring level to LOW to enable the display of this additional information. Set the
monitoring level to HIGH to also view information pertaining to each live thread in the system.
More information on the additional monitoring features for Java SE is available in a document
titled Monitoring and Management for the Java Platform, which is available from
http://java.sun.com/javase/6/docs/technotes/guides/management/.
The Java SE monitoring tools are discussed at
http://java.sun.com/javase/6/docs/technotes/tools/#manage.
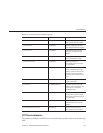
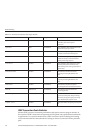
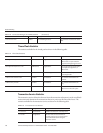
The statistics available for class loading in the JVM in Java SE are shown in the following table.
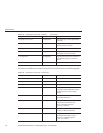
TABLE18–17 JVM Statistics forJava SE-Class Loading
Statistic DataType Description
loadedclasscount CountStatistic Numberof classes that are currently
loaded in theJVM.
AboutMonitoring
Chapter18 • MonitoringComponents andServices 187


