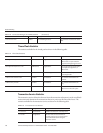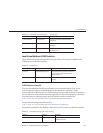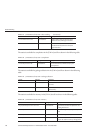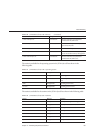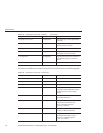
servlet, connection, connectorpool, endpoint, entitybean, messagedriven,
statefulsession, statelesssession, httpservice,orwebmodule.
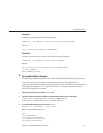
For example, to view data for jvm on server, enter the following:
asadmin>monitor --type jvm --user adminuser server
JVM Monitoring
UpTime(ms) HeapSize(bytes)
current min max low high count
327142979 0 531628032 0 45940736 45940736
To view monitoring data and send theoutput to a CSVle, use the lenameoption. For
example:
asadmin> monitor --type jvm --filename myoutputfile --user adminuser server
▼
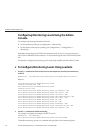
To Use the asadmin get and list Commands to View Monitoring Data
The monitor command is useful in most situations. However, it does not oer the complete list
of all monitorable objects. To view all monitorable data using the asadmin tool, use the asadmin
list and asadmin get commands followed by the dotted name of a monitorable object, as
follows.
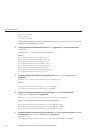
To view the names of the objects that can be monitored, use the asadmin list command.
For example, to view a list of application components and subsystems that have monitoring
enable for the server instance, type the following command in a terminal window:
asadmin> list --user adminuser --monitor server
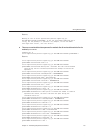
The preceding command returns a list of application components and subsystems that have
monitoring enabled, for example:
server.resources
server.connector-service
server.orb
server.jms-service
server.jvm
server.applications
server.http-service
server.sip-service
server.thread-pools
For further examples using the list command, refer to “Examples of the list and get
Commands” on page 196
. For further information on the dotted names you can use with the
list command, refer to
“Understanding and Specifying Dotted Names” on page 195.
2
1
ViewingMonitoringData
SunGlassFishEnterpriseServer2.1AdministrationGuide • December2008194


