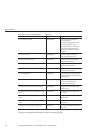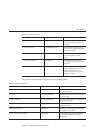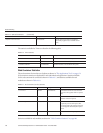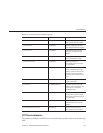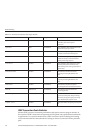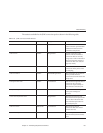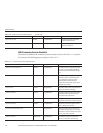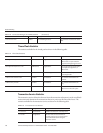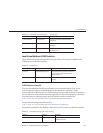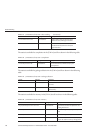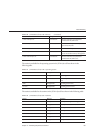
TABLE18–9 HTTP ServiceStatistics (Developer Prole)
Statistic Units DataType Comments
bytesreceived Bytes CountStatistic Thecumulative value of the bytes
received by eachof the request
processors.
bytessent Bytes CountStatistic The cumulative value of the bytessent by
each of therequest processors.
currentthreadcount Number CountStatistic Thenumber of processing threads
currently in thelistener thread pool.
currentthreadsbusy Number CountStatistic Thenumber of request processing
threads currently inuse in the listener
thread pool servingrequests.
errorcount Number CountStatistic Thecumulative value of the errorcount,
which represents thenumber of cases
where the responsecode is greater than or
equal to 400.
maxsparethreads Number CountStatistic Themaximum number of unused
response processing threadsthat can
exist.
minsparethreads Number CountStatistic Theminimum number of unused
response processing threadsthat can
exist.
maxthreads Number CountStatistic Themaximum number of request
processing threads createdby the listener.
maxtime Milliseconds CountStatistic Themaximum amount of time for
processing threads.
processing-time Milliseconds CountStatistic Thecumulative value of thetimes taken
to process eachrequest. The processing
time is theaverage of request processing
times divided bythe request count.
request-count Number CountStatistic Thetotal number of requestsprocessed so
far.
JDBC Connection Pools Statistics
Monitor JDBC resources to measure performance and capture resource usage at runtime. As
the creation of JDBC connections are expensive and frequently cause performance bottlenecks
in applications, it is crucial to monitor how a JDBC connection pool is releasing and creating
new connections and how many threads are waiting to retrieve a connection from a particular
pool.
AboutMonitoring
SunGlassFishEnterpriseServer2.1AdministrationGuide • December2008182


