


90
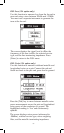
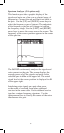
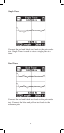
Spectrum Analyzer (/SA option only)
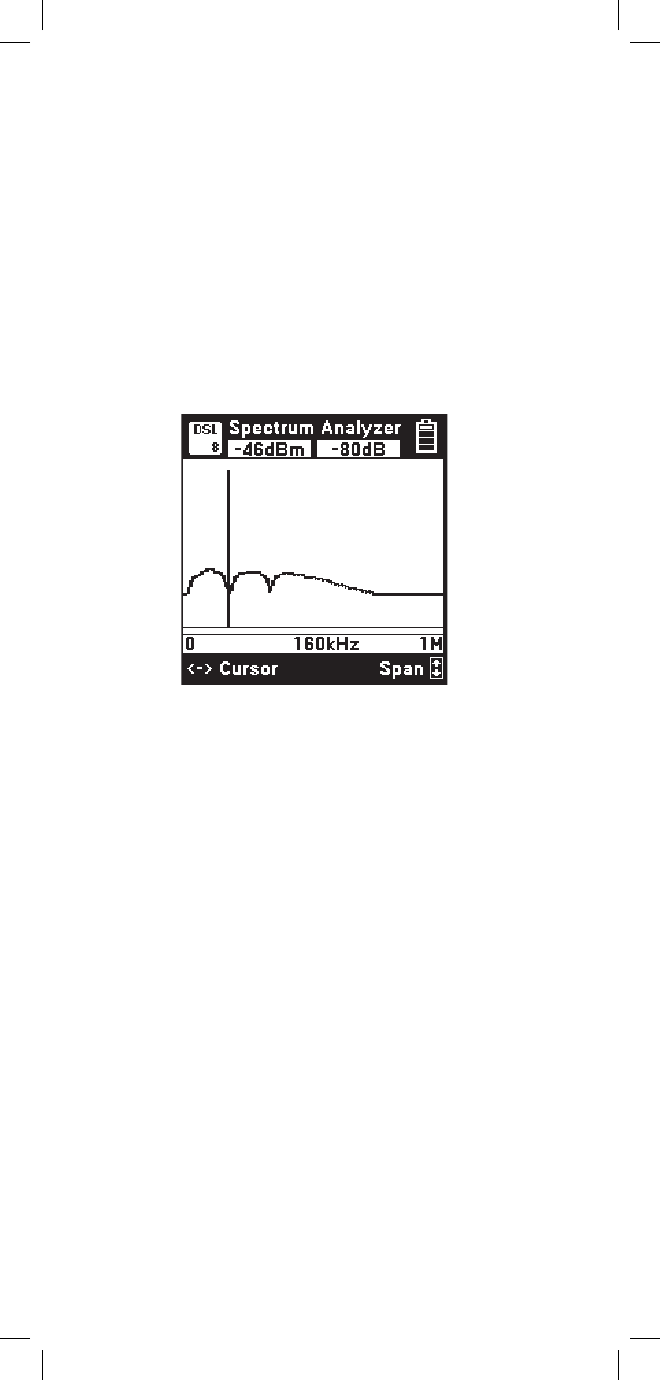
This function provides a graphic display of the
signals and noise on a line over a selected range of
frequencies. Connect the red and black test leads to
the pair. Use the [UP] and [DOWN] arrow keys to
select the frequency span of interest. The endpoints
of the frequency span bar will change to indicate
the frequency range. Use the [LEFT] and [RIGHT]
arrow keys to move the cursor across the screen. The
frequency of the cursor position appears in the center
of the span bar.
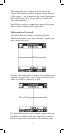
The 965DSP continuously analyzes the signals and
noise present on the pair. The screen displays the
average power of all the signals and noise in the
selected span in dBm at the upper left. The actual
signal level at the cursor position is displayed in dB
at the upper right.
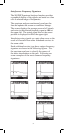
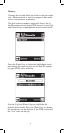
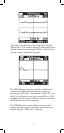
Interfering noise signals on a pair often occur
as the result of crosstalk from other wideband
services in the same cable. Each wideband service
type has a unique frequency signature. Use the
spectrum analyzer to classify the source of the noise
interference on a pair.