


CASIO
5-8
k Zoom
This function lets you enlarge and reduce the graph on the screen.
1. Draw the graph.
2. Specify the zoom type.
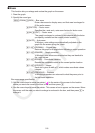
!2(ZOOM) 1(BOX) ... Box zoom
Draw a box around a display area, and that area is enlarged to
fill the entire screen.
2(FACTOR) ... Factor zoom
Specifies the
x -axis and y -axis zoom factors for factor zoom.
3(IN)/ 4(OUT) ... Factor zoom
The graph is enlarged or reduced in accordance with the factor
you specify, centered on the current pointer location.
5(AUTO) ... Auto zoom
V-Window
y -axis settings are automatically adjusted so the
graph fills the screen along the y -axis.
6( g) 1(ORIGINAL) ... Original size
Returns the graph to its original size following a zoom operation.
6( g) 2(SQUARE) ... Graph correction
V-Window
x -axis values are corrected so they are identical to
the
y -axis values.
6( g) 3(ROUND) ... Coordinate rounding
Rounds the coordinate values at the current pointer location.
6( g) 4(INTEGER) ... Integer
Each dot is given a width of 1, which makes coordinate values
integers.
6( g) 5(PREVIOUS) ... Previous
V-Window parameters are returned to what they were prior to
the last zoom operation.
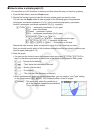
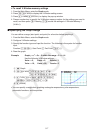
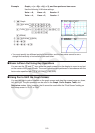
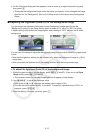
Box zoom range specification
3. Use the cursor keys to move the pointer (
) in the center of the screen to the location
where you want one corner of the box to be, and then press w.
4. Use the cursor keys to move the pointer. This causes a box to appear on the screen. Move
the cursor until the area you want to enlarge is enclosed in the box, and then press w to
enlarge it.