


CASIO
15-2
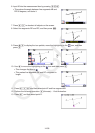
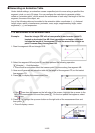
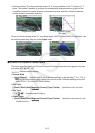
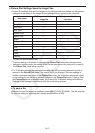
• Add time values (T) to the coordinate values (X, Y) and plot points on the T-X plane or T-Y
plane. This makes it possible to produce the mathematical expressions and graphs of the
correlation between horizontal direction movement and time, and the correlation between
vertical direction movement and time.
Regression graph T-X regression graph
(left side)
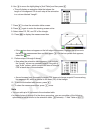
During full-screen display of an X-Y coordinate graph, SKETCH and G-SOLVE operations can
be used the same way they are in the Graph mode.
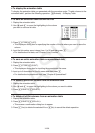
k Picture Plot Specific Setup Items
The items described below are Picture Plot specific Setup screen items that appear only after
you press !m(SET UP).
indicates default setting.
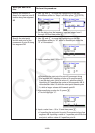
• Axtrans Wind
• {Auto}/{Manual} ... Specifies {link to the V-Window settings on the left side (T-Y or T-X) of
the AXTRANS screen for auto setting}/{do not link to the V-Window settings on the left
side (T-Y or T-X) of the AXTRANS screen}
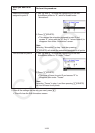
• Plot Color
• {Black}/{Blue}/{Red}/{Magenta}/{Green}/{Cyan}/{Yellow} ... Specifies a color for plots.
• Plot Type
• {Ⅺ}/{
}/{Ⅵ} ... Specifies the plot figure.
• Sketch Color
• {Black}/{Blue}/{Red}/{Magenta}/{Green}/{Cyan}/{Yellow} ... Specifies a draw color for the
Sketch function.