


CASIO
6-16
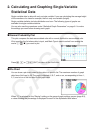
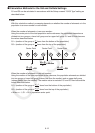
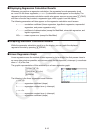
k Displaying Regression Calculation Results
Whenever you perform a regression calculation, the regression formula parameter (such
as a and b in the linear regression y = ax + b ) calculation results appear on the display. The
regression formula parameter calculation results also appear as soon as you press 1(CALC)
and then a function key to select a regression type, while a graph is on the display.
The following parameters will also appear on the regression calculation result screen.
r ..............correlation coefficient (linear regression, logarithmic regression, exponential
regression, and power regression only)
r
2
.............coefficient of determination (except for Med-Med, sinusoidal regression, and
logistic regression)
MSe .........mean square error (except for Med-Med)
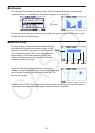
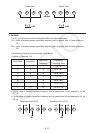
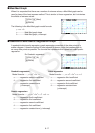
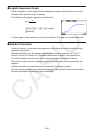
k Graphing Statistical Calculation Results
While the parameter calculation result is on the display, you can graph the displayed
regression formula by pressing 6(DRAW).
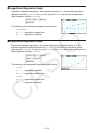
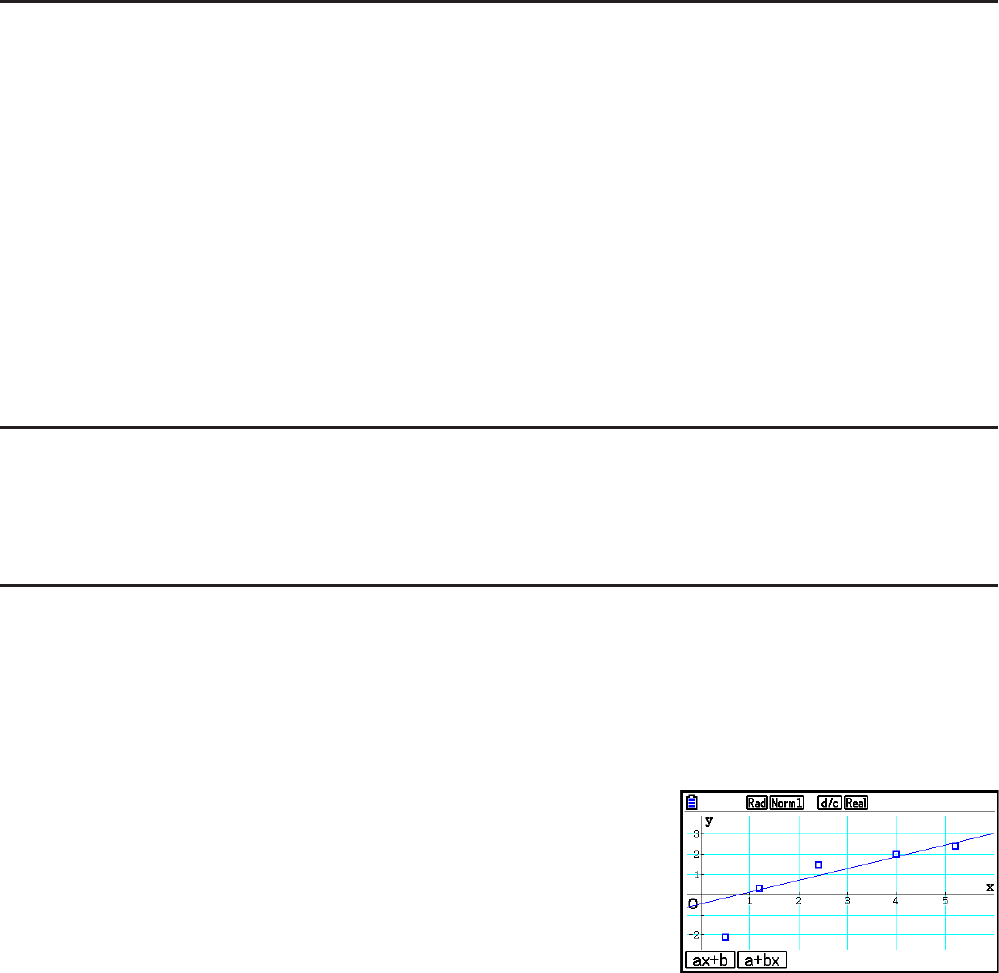
k Linear Regression Graph
Linear regression uses the method of least squares to plot a straight line that passes close to
as many data points as possible, and returns values for the slope and y -intercept ( y -coordinate
when x = 0) of the line.
The graphic representation of this relationship is a linear regression graph.
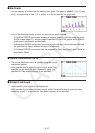
1(CALC) 2(X)
1(
ax + b ) or 2( a + bx )
6(DRAW)
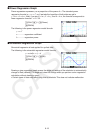
The following is the linear regression model formula.
y = ax + b
a
.............regression coefficient (slope)
b .............regression constant term ( y -intercept)
y = a + bx
a
.............regression constant term ( y -intercept)
b .............regression coefficient (slope)