


CASIO
6-49
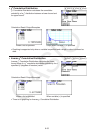
The following shows the parameter data specification items that are different from list data
specification.
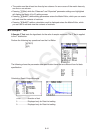
Calculation Result Output Example
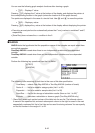
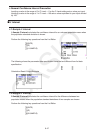
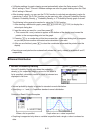
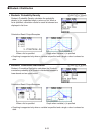
u 2-Sample t Interval
2-Sample t Interval calculates the confidence interval for the difference between two
population means when both population standard deviations are unknown. The t interval is
applied to t distribution.
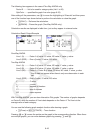
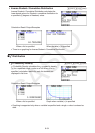
Perform the following key operations from the List Editor.
4(INTR)
2(t)
2(2-SAMPLE)
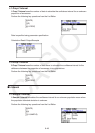
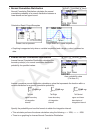
7. Distribution
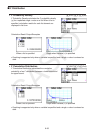
There is a variety of different types of distribution, but the most well-known is “normal
distribution”, which is essential for performing statistical calculations. Normal distribution
is a symmetrical distribution centered on the greatest occurrences of mean data (highest
frequency), with the frequency decreasing as you move away from the center. Poisson
distribution, geometric distribution, and various other distribution shapes are also used,
depending on the data type.
Certain trends can be determined once the distribution shape is determined. You can calculate
the probability of data taken from a distribution being less than a specific value.
For example, distribution can be used to calculate the yield rate when manufacturing some
product. Once a value is established as the criteria, you can calculate normal probability when
estimating what percent of the products meet the criteria. Conversely, a success rate target
(80% for example) is set up as the hypothesis, and normal distribution is used to estimate the
proportion of the products will reach this value.