


CASIO
6-19
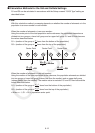
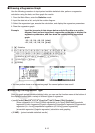
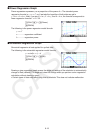
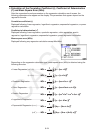
k Power Regression Graph
Power regression expresses y as a proportion of the power of x . The standard power
regression formula is y = a × x
b
, so if we take the logarithm of both sides we get In
y = In a + b × In x . Next, if we say X = In x , Y = In y , and A = In a , the formula corresponds to
linear regression formula Y = A + b X.
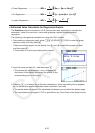
1(CALC) 6( g) 4(Power)
6(DRAW)
The following is the power regression model formula.
y = a · x
b
a .............. regression coefficient
b .............. regression power
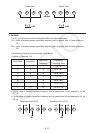
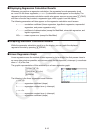
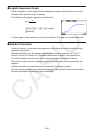
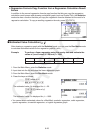
k Sinusoidal Regression Graph
Sinusoidal regression is best applied for cyclical data.
The following is the sinusoidal regression model formula.
y = a ·sin( bx + c ) + d
1(CALC) 6( g) 5(Sin)
6(DRAW)
Drawing a sine regression graph causes the angle unit setting of the calculator to automatically
change to Rad (radians). The angle unit does not change when you perform a sine regression
calculation without drawing a graph.
• Certain types of data may take a long time to calculate. This does not indicate malfunction.