


CASIO
2010080120100801
ε-44
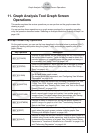
Graph Analysis Tool Graph Screen Operations
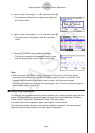
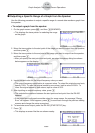
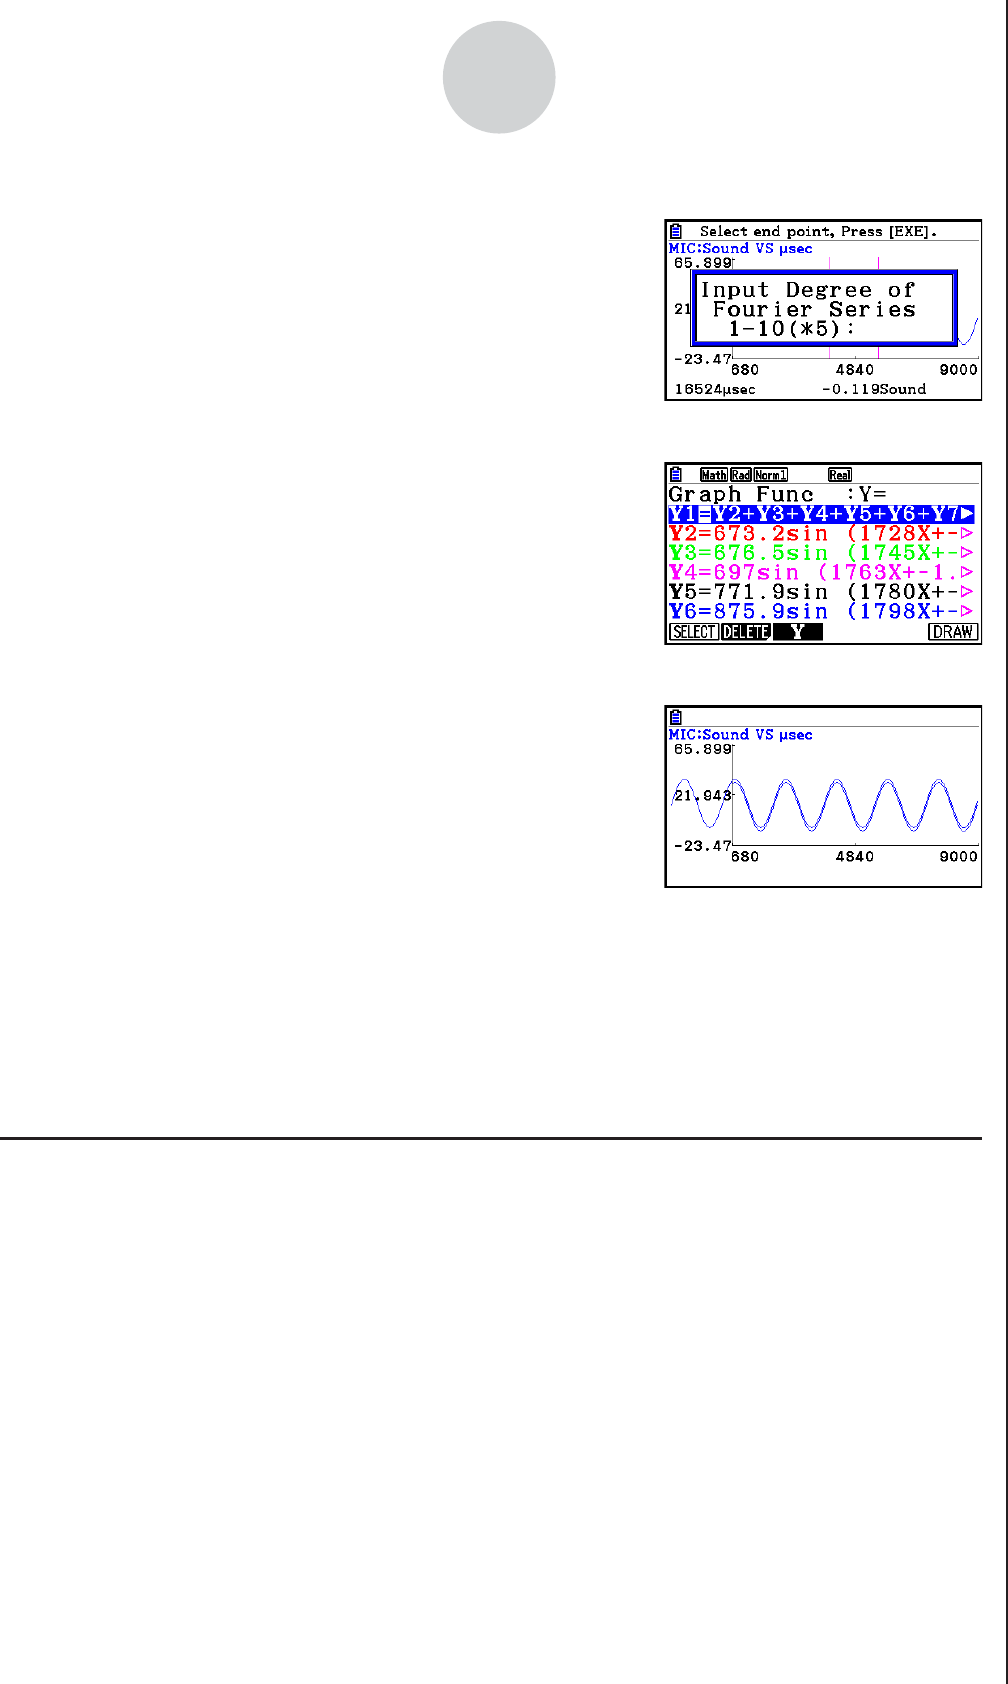
5. Input a value in the range of 1 to 99, and then press w.
• This displays a dialog box for inputting the degree of
the Fourier series.
6. Input a value in the range of 1 to 10, and then press w.
• The graph relation list appears with the calculation
result.
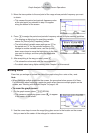
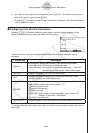
7. Pressing 6(DRAW) here graphs the function.
• This lets you compare the expanded function graph
and the original graph to see if they are the same.
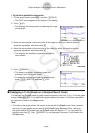
Note
• When you press 6(DRAW) in step 7, the graph of the result of the Fourier series
expansion may not align correctly with the original graph on which it is overlaid. If this
happens, shift the position the original graph to align it with the overlaid graph.
For information about how to move the original graph, see “To move a particular graph on
a multi-graph display” (page
ε-47).
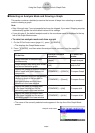
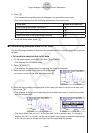
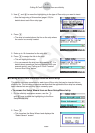
k Performing Regression
You can use the procedure below to perform regression for a range specified using the trace
pointer. All of the following regression types are supported: Linear, Med-Med, Quadratic,
Cubic, Quartic, Logarithmic, Exponential, Power, Sine, and Logistic.
For details about these regression types, see Chapter 6 of this manual.
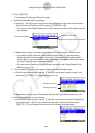
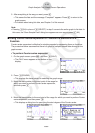
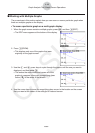
The following procedure shows how to perform quadratic regression. The same general
steps can also be used to perform the other types of regression.