


CASIO
6-9
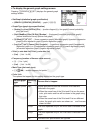
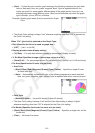
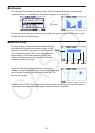
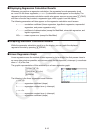
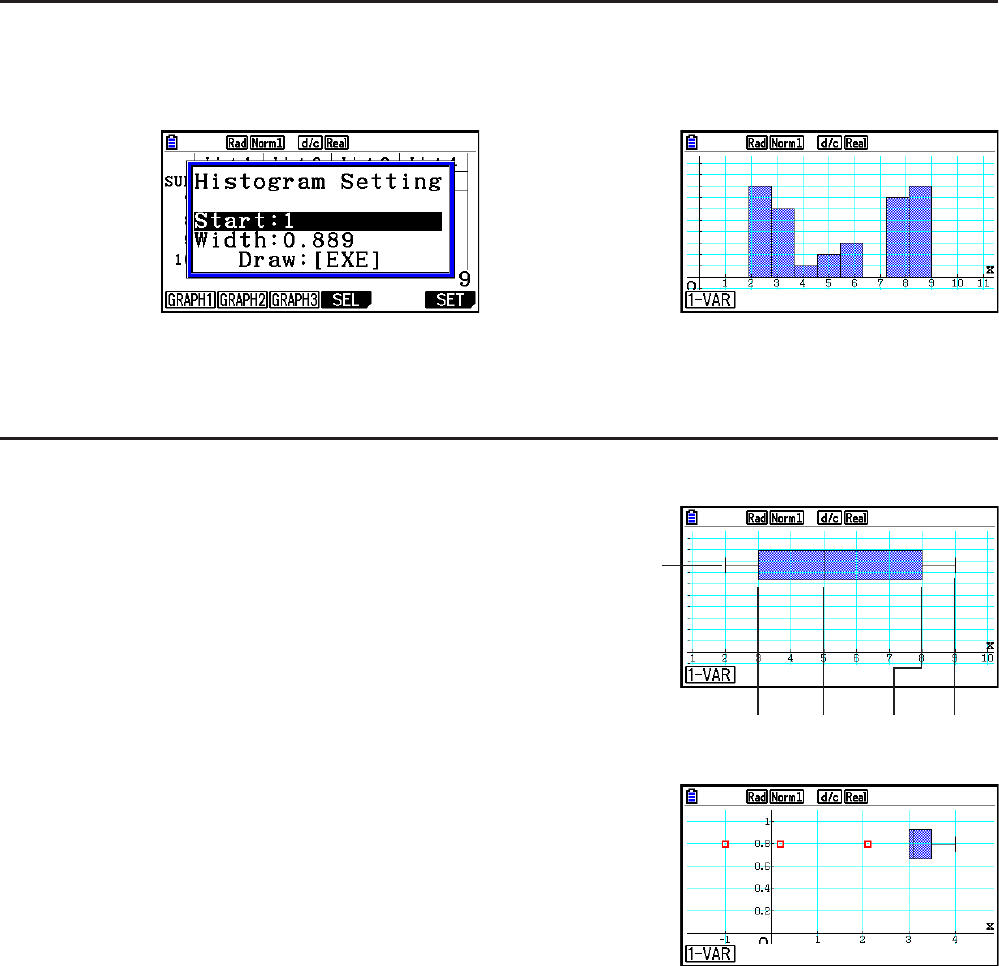
k Histogram
XList specifies the list where the data is input, while Freq specifies the list where the data
frequency is input. 1 is specified for Freq when frequency is not specified.
⇒
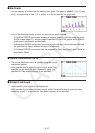
w(Draw)
The display screen appears as shown above before the graph is drawn. At this point, you can
change the Start and Width values.
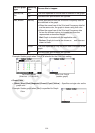
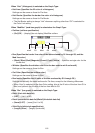
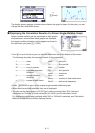
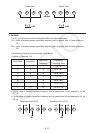
k Med-box Graph
This type of graph lets you see how a large number of
data items are grouped within specific ranges. A box
encloses all the data in an area from the first quartile
(Q1) to the third quartile (Q3), with a line drawn at the
median (Med). Lines (called whiskers) extend from
either end of the box up to the minimum (minX) and
maximum (maxX) of the data.
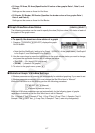
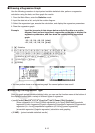
To plot the data that falls outside the box, first specify
“MedBox” as the Graph Type. Then, on the same screen you
use to specify the graph type, turn the Outliers item “On”,
and draw the graph.
• Changing the “Q1Q3 Type” setting on the Setup screen can cause the Q1 and Q3 positions
to change, even when a Med-box graph is drawn based on a single list.
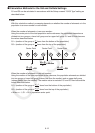
minX
MedQ1 Q3 maxX
minX
MedQ1 Q3 maxX