


CASIO
6-5
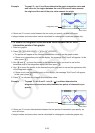
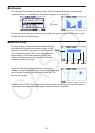
• {Auto} ... Cycles the color used for graph drawing in the following sequence for each data
item (or data pair): blue, red, green, magenta, black. Cycle is repeated after all five
colors are used. For some graphs, different parts of the graph (points, lines, etc.) are
automatically drawn using different colors. {Auto} can be selected only when the graph
type is Scatter,
xyLine, NPPlot, or Broken.
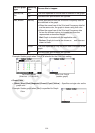
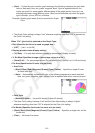
Example: Scatter graph when {Auto} is specified for Graph
Color
• The Graph Color setting is always “Link” whenever anything other than “Off” is selected for
the Color Link setting.
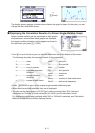
When “Pie” (pie chart) is selected as the Graph Type:
• Data (Specifies the list to be used as graph data.)
• { LIST } ... {List 1 to List 26}
• Display (pie chart value display setting)
• { % } / { Data } ... For each data element {display as percentage}/{display as value}
• % Sto Mem (Specifies storage of percentage values to a list.)
• { None } / { List } ... For percentage values: {Do not store to list}/{Specify List 1 to 26 and store}
• Pie Area (Specifies the fill color of a pie chart.)
• Area Color
• {Black}/{Blue}/{Red}/{Magenta}/{Green}/{Cyan}/{Yellow} ... Specifies a single fill color
for each data item.
• {Auto} ... Automatically cycles the fill color in the following sequence for each data item:
blue, red, green, magenta, cyan, yellow. Cycle is repeated after all six colors are used.
• Paint Style
• {Normal}/{Lighter} ... {normal fill density}/{lighter fill density}
• The Area Color setting is always “Link” and the Paint Style setting is always “Lighter”
whenever anything other than “Off” is selected for the Color Link setting.
• Pie Border (Specifies the border line color of a pie chart.)
• {Black}/{Blue}/{Red}/{Magenta}/{Green}/{Cyan}/{Yellow} ... Specifies a single color for the
border line.
• {Clear} ... No border line drawn.